
Table 8.
Comparison between the sensory test results and the patients' subjective symptoms (total=52)
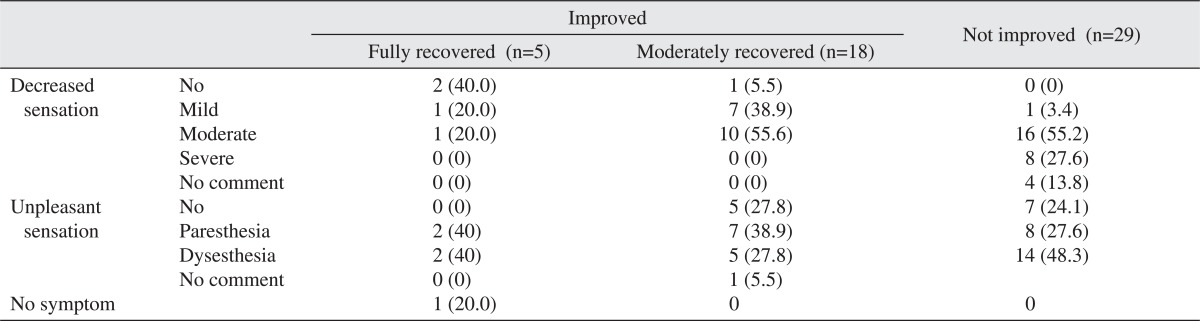
Values are presened as number (%).
Official websites use .gov
A
.gov website belongs to an official
government organization in the United States.
Secure .gov websites use HTTPS
A lock (
) or https:// means you've safely
connected to the .gov website. Share sensitive
information only on official, secure websites.
Comparison between the sensory test results and the patients' subjective symptoms (total=52)
Values are presened as number (%).