
Figure 4. Ratios of appearing and disappearing interactions.
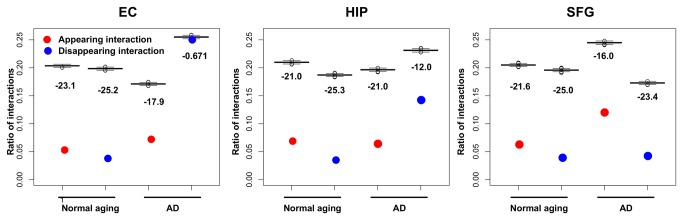
Red plots indicate the ratios of appearing protein interactions, and blue plots indicate disappearing protein interactions. The boxplots indicate the ratios of appearing and disappearing protein interactions from 1,000 corresponding randomized networks in each brain region in normal aging and AD. Values below the boxplots show the Z-scores between the ratio and the ratios of 1,000 randomized networks. The ratio of the number of disappearing interactions in the AD entorhinal cortex (EC) region showed no significant difference from those of the 1,000 randomized networks (Z-score = −0.671).