Fig. 5.
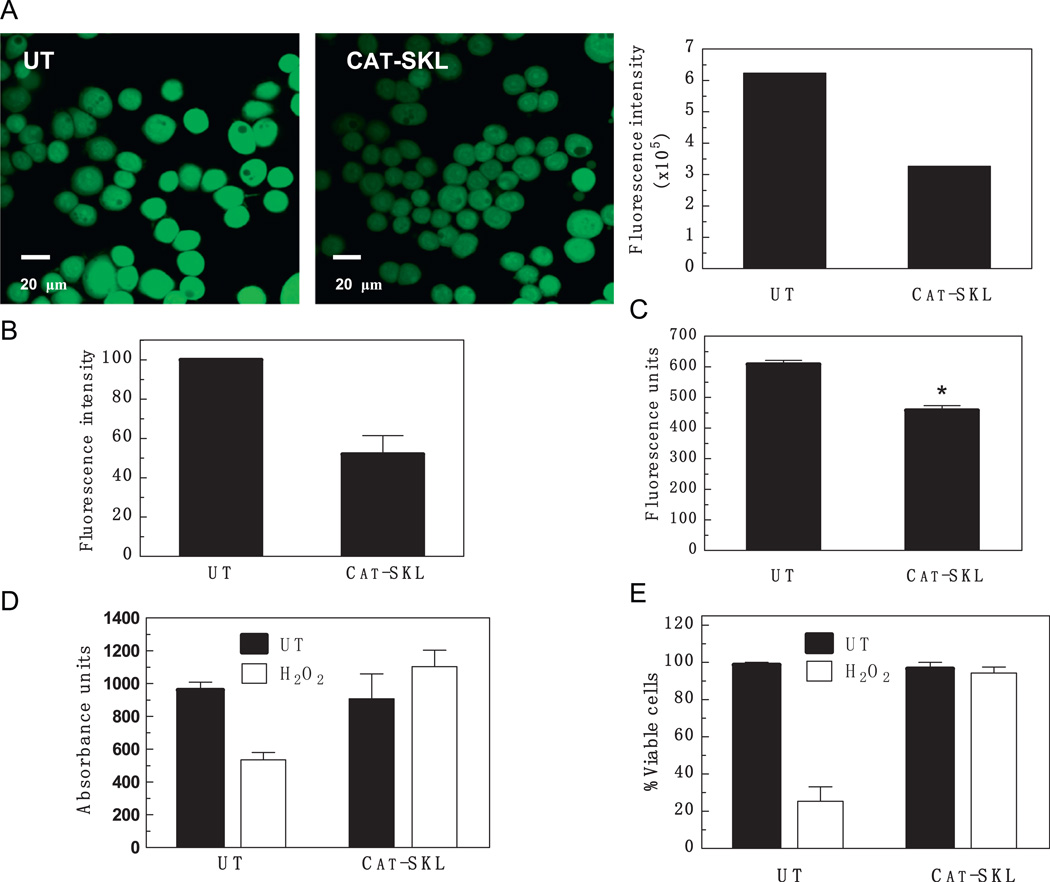
Effect of CAT-SKL on ROS levels in MDA-MB-468 cells. (A) Cells were pretreated or not (“UT”) with CAT-SKL (1 µM) for 4 h and then examined for the presence of ROS using DCF-DA (25 µM). The accompanying histogram represents MetaMorph®-based quantification of the cellular fluorescence intensities seen in the ROS images. (B) Cellular fluorescence intensities from three experiments (including the one shown in (A)) were pooled and normalized to the untreated control value (arbitrarily set at 100) to permit comparison. Results presented are the mean±1 SD. (C) H2O2 was specifically measured employing the Amplex® Red Reagent (10-acetyl-3,7-dihydroxy-phenoxazine). The decline is statistically significant; *p-value<0.01. (D) and (E) MDA-MB-468 cells were pretreated with CAT-SKL (1 µM) for 4 h and then challenged with H2O2 for 2 h (1mM). Cell viability was determined either using the water soluble tetrazolium cell proliferation assay (WST-1) (D), or by quantitative trypan blue exclusion assays (E).

