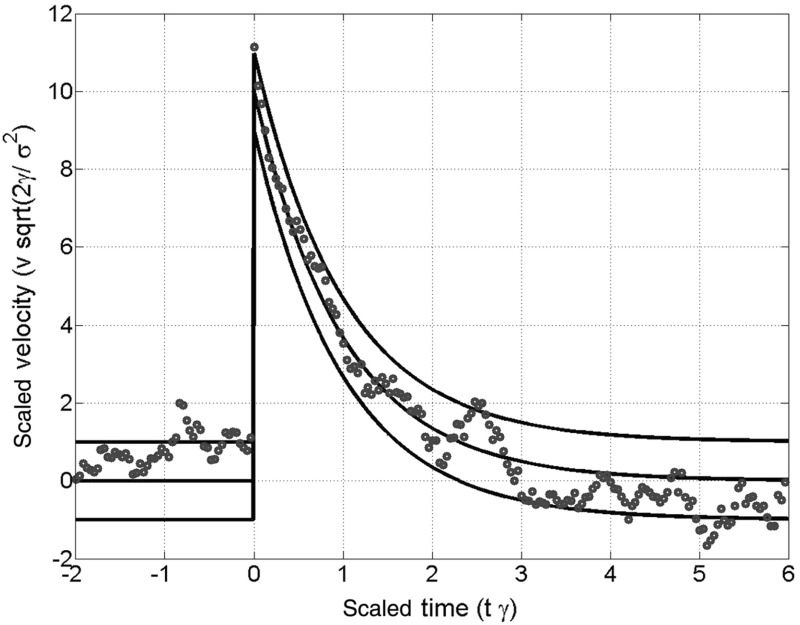
Fig. 2.
Points on a sample path of the normalized kicked Ornstein–Uhlenbeck process defined by the Langevin Eq. 6. The solid lines represent the mean, and mean standard deviation of the scaled velocity coordinate. At the time a value of has been added to the scaled velocity. After some time the information of the amplitude gets more and more lost due to the fluctuations

