
Figure 1. Diagram showing QA calculation from a spin distribution function.
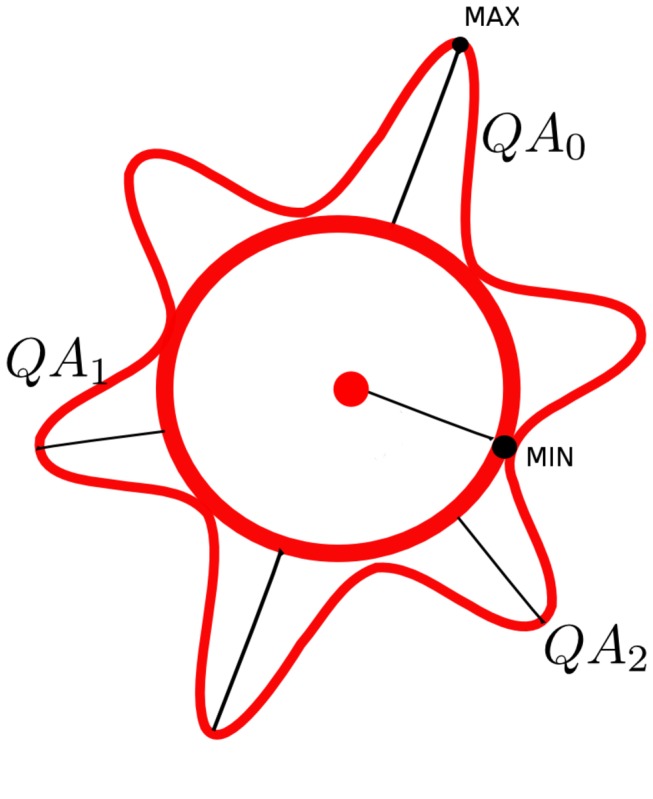
The red outer contour represents the spin distribution function calculated by generalized q-sampling imaging, whereas the sphere at the center is the isotropic component estimated by its minimum value. A QA value is defined for each peak orientation, and it serves as an index to differentiate less salient peaks and to selectively remove them. (Eleftherios Garyfallidis, "Towards an accurate brain tractography", PhD thesis, University of Cambridge, 2012, use with permission).