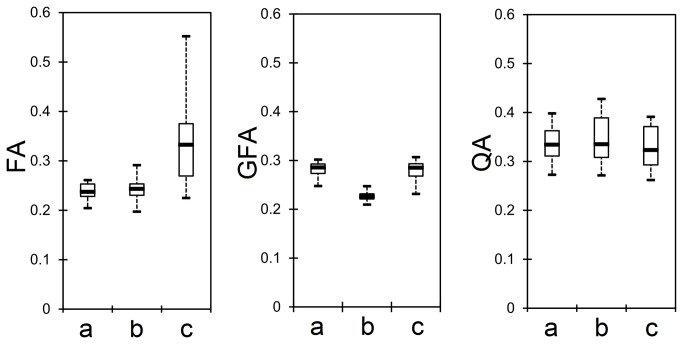
Figure 6. Box plots showing the first quartile, median value, and third quartile of FA, GFA, and QA distributions under three different partial volume conditions: (a) fibers/free water, (b) fibers crossing, and (c) fibers/non-diffusive materials.
The FA and GFA are affected by the partial volume conditions, whereas the QA distribution remains relatively consistent regardless of the partial volume conditions.

