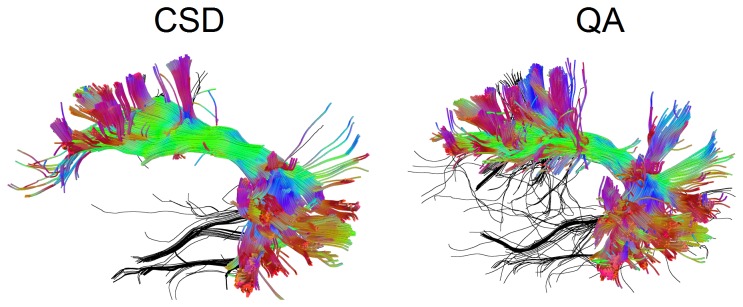
Figure 12. The QA-aided tractography compared with the CSD tractography.

Both tractographies were generated using the same HARDI dataset. The QA-aided tractography used spin distribution functions to resolve crossing fibers without deconvolution, whereas CSD tractography used constrained spherical deconvolution to improve the angular resolution. The false tracks identified by a neurosurgeon (Y. W.) are colored in black, whereas accurate trajectories are coded by directional color. The QA-aided tractography shows an average of 16.20% of false fibers, whereas the CSD tractography shows an average of 15.38% fiber fibers. The difference is within the error range (1.3%) estimated using bootstrap resampling.
