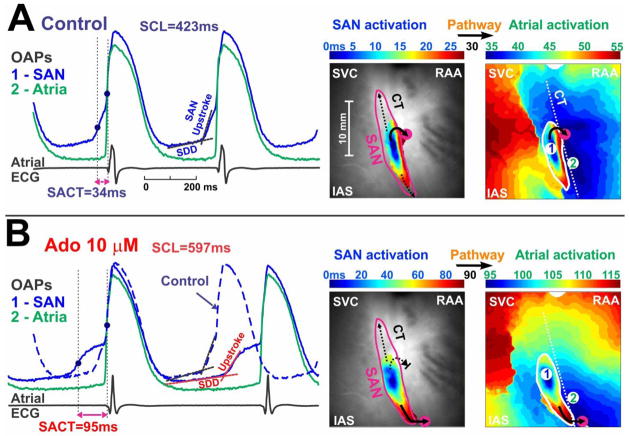
Figure 2. Adenosine depresses SAN conduction during sinus rhythm.
On the left are the optical action potentials (OAPs) and pseudo atrial ECG in control condition (A) and during perfusion of 10 μM adenosine (B). The blue OAP (#1) is from the SAN; the green (#2) is from the atria. Optical recordings from the SAN exhibit the slow diastolic depolarization (SDD), slowly rising upstroke of the SAN (SAN component) and the rapidly rising upstroke of the atrial myocardium (atrial component). SAN activation time (SACT) is the delay between the SAN activation and the atrial activation. On the right are maps for SAN activation and subsequent atrial activation in control (A) and 10 μM adenosine (B). Black arrows indicate the pathways through which the activation exits from the SAN to the atria.

