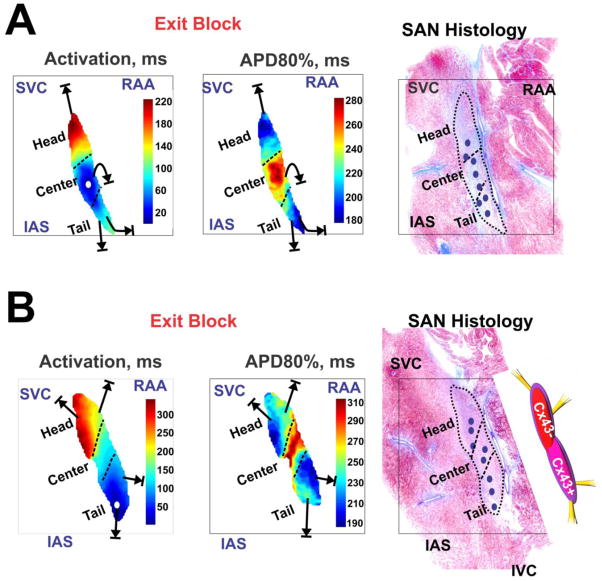
Figure 7. SAN activation and repolarization during SAN exit block.
(A) and (B) show the activation maps and action potential duration (APD) maps at 80% recovery (APD80%) for two canine SANs. Note that conduction in the head of SAN is slower compared to the tail of SAN, consistent with more Cx43 expression in the inferior part of SAN compared to the superior part. Far right, histology overlays display a graphic representation of SAN complexes. Blue small ovals indicate locations of leading pacemaker sites during adenosine-induced exit block and recovery from it.

