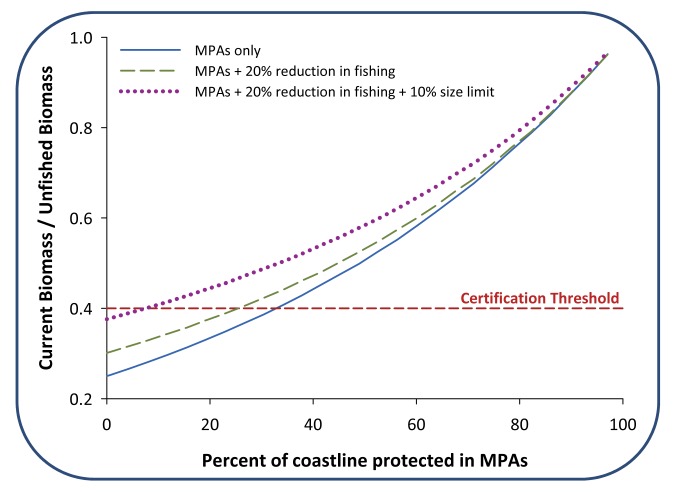
Figure 3. Bioeconomic models can be used to compare different strategies for achieving seafood sustainability.
In this example based on the sheephead fishery in Southern California, we assume that one requirement of the certification scheme is for the biomass of the target species to be at least 40% of unfished biomass. With MPAs alone, biomass is predicted to equilibrate at certifiable levels if one third of the coastline is closed to fishing (blue solid curve). If effort is reduced by 20%, certification can be achieved by closing only one quarter of the coastline to fishing (green dashed curve). If that reduction in effort is accompanied by a 10% increase in the size limit, less than one tenth of the coastline need be closed to raise the population to 40% of its unfished biomass (purple dotted curve). Reducing fishing effort by 20% and raising the size limit is not sufficient for achieving certification without at least some MPA protection, but a mix of more conservative non-spatial regulations could achieve certification without any MPAs (not shown). See Text S1 for additional methods.

