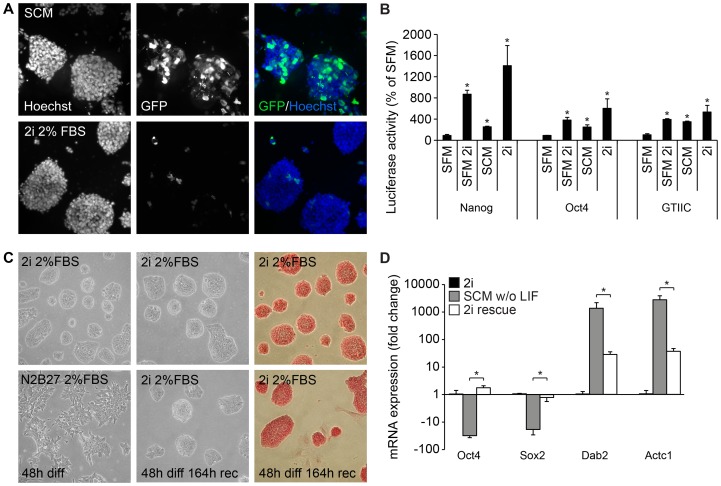
Figure 5. Characterisation of mouse ES cells cultured in 2i media.
Fluorescence micrographs of GFP-expression E14 mES cells, pre-transfection cultured in 2i or SCM, transfected with Lipofectamine 2000 and pmaxGFP (A). Luciferase reporter assay for Oct4 and Nanog promoter activation, as well as Tead-enhanced promoter activation, 24 hrs post-transfection in E14 cells cultured without LIF in serum-free SCM with or without PD0325901 (1 μM) and CH99021 (3 μM), SCM, or 2i media. Results are mean ± sd (n = 3) p(*) <0.05 (B). Phase-contrast micrographs of colony morphology and alkaline phosphatase activity staining (C), and qPCR analysis (D) of E14 cell 96 hrs after 2i rescue and clean-up of partially differentiated mES cells cultures. 18S expression is used for normalization, and results are comparative (expression levels at passage 15 set as control) Ct value means ± sd (n = 3) p(*) <0.05.

