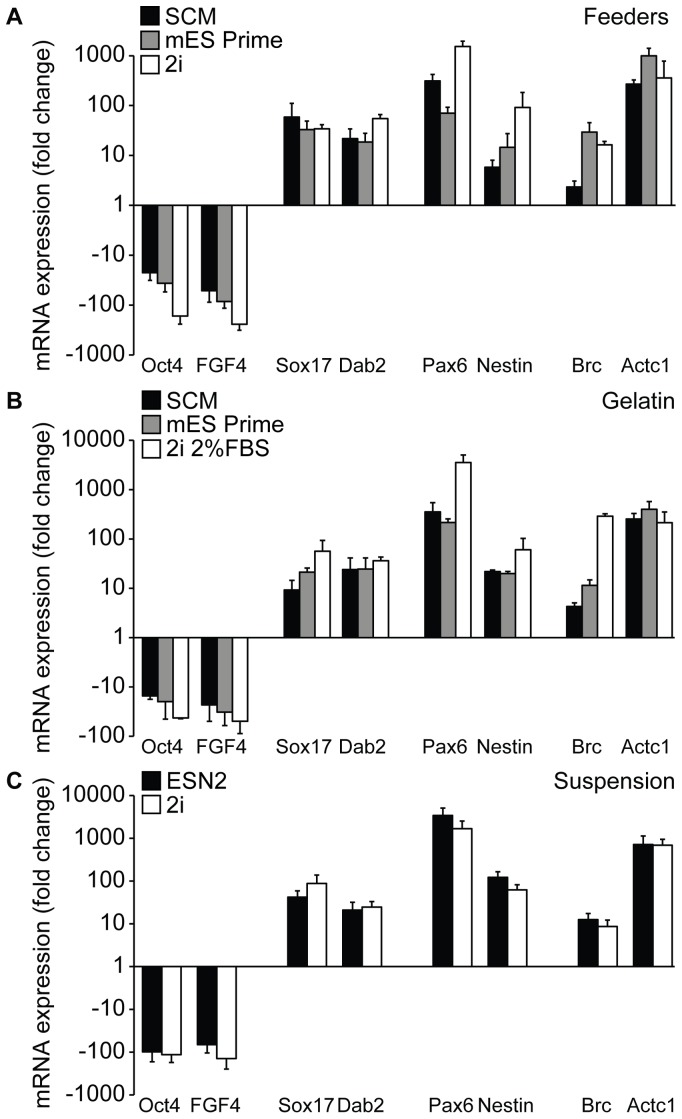
Figure 6. Analysis of ES cells induced to differentiate as assessed by quantitative PCR.
Quantitative PCR analysis for the expression of Oct4 and FGF4 and indicator genes for the three germ layers in mES cells that were induced to differentiate for 6(A) or on gelatin (B) in SCM, mES Prime Kit or 2i media, and in suspension (C) in 2i or ESN2 media. 18S expression is used for normalization, and results are comparative (expression levels at passage 15 set as control) Ct value means ± sd (n = 3).

