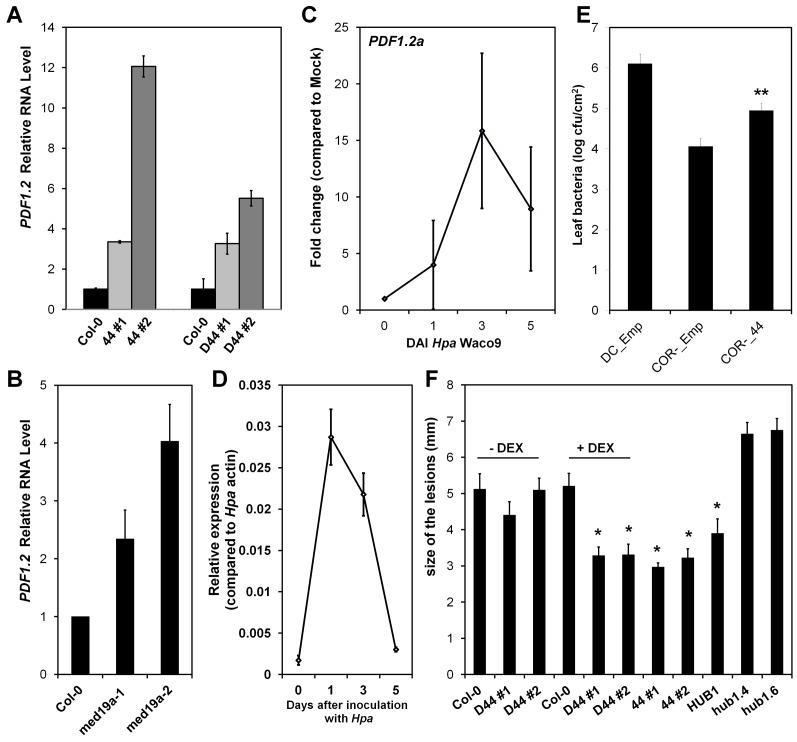
Figure 7. HaRxL44-expressing lines, med19a mutants show elevated JA/ET signalling, which is also observed after Hpa infection.
(A and B) qRT-PCR results on PDF1.2 marker gene. Data are presented as average fold induction compared with control of three biological replicates ± SD. (C) Expression pattern of PDF1.2 during a time course of Hpa Waco9 infections in Arabidopsis Col-0 extracted from expression profiling experiment. (D) Expression pattern of HaRxL44 during a time course of Hpa Waco9 infection in Arabidopsis Col-0 analysed by qRT-PCR. Data are presented as average fold induction compared with control of three biological replicates ± SD. (E) Monitoring of Pst growth in Arabidopsis Col-0. DC_Emp, Pst DC3000 strain carrying EDV vector; COR-_Emp, PstCOR − strain carrying EDV vector, COR-_44, PstCOR − strain carrying EDV-HaRxL44. Error bars represent the standard error of the mean (Tukey–Kramer test, p value<0.01). (F) Monitoring of Botrytis cinerea growth 5 DAI in transgenic lines expressing HaRxL44 under the control of DEX inducible promoter (D44 lines) in the presence or not of dexamethazone and under the control of 35S promoter (44 lines). Col-0, HUB1 OE, as well as hub1 KO mutants were used as controls. Error bars represent the standard error of the mean. Asterisks represent the significance of individual unpaired t tests comparing the given column with the control (p value<0.01).

