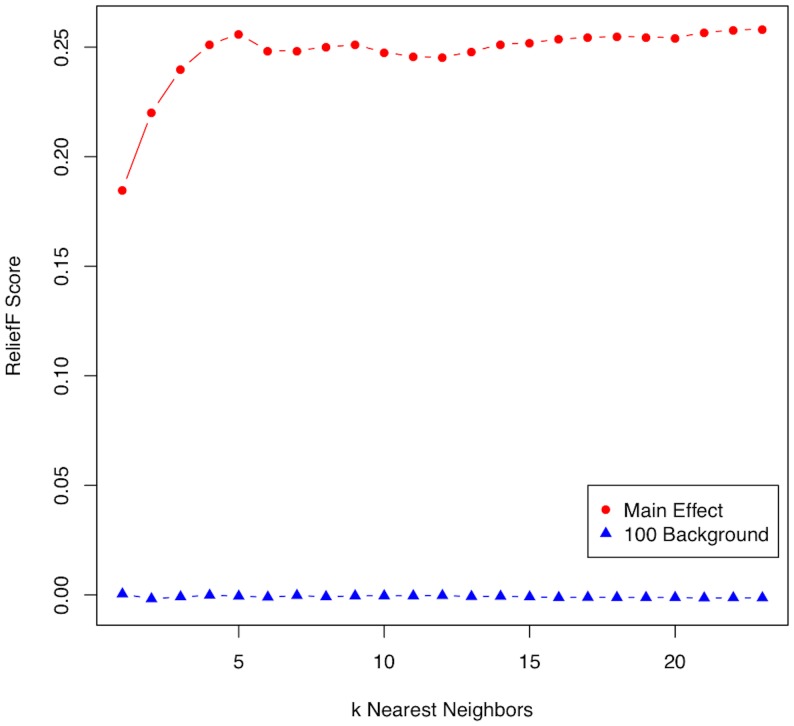
Figure 2. Illustration of the effect of the number of nearest neighbors (k) on the Relief-F score for a main effect transcript (red circles) from one of the simulated data sets.
The vertical axis is the Relief-F importance score (Equation (1)); the horizontal axis is the number of nearest neighbors, k. For main effects, a larger k is suggested because Relief-F converges to a univariate attribute estimator (myopic). For comparison, the average scores for 100 random null transcripts (blue triangles) in the data set are plotted versus k. Regardless of k, the Relief-F scores remain low for noise genes.

