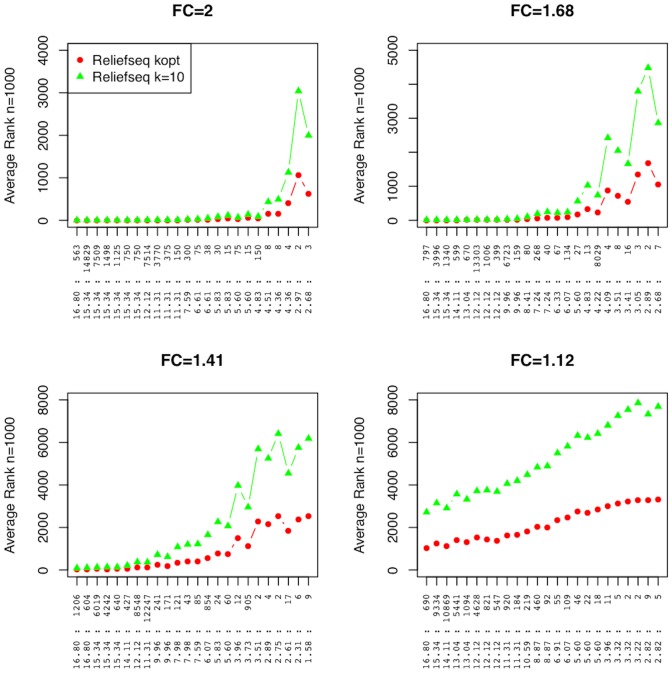
Figure 5. Main effect simulation results comparing gene-wise adaptive-k ReliefSeq with standard Relief-F (k = 10).
Average ranks of 96 main effects of different size for ReliefSeq with gene-wise adaptive k compared with standard Relief-F with k = 10 nearest neighbors. The 96 main effect genes are simulated in each data set with a background of null genes for a total of 16,920 genes. The 96 main effect genes are split into four panels based on fold change (FC) labeled on the raw scale. The horizontal axis of each plot is labeled by the combination of negative binomial parameters (θ:µ) of the main effect gene. Genes toward the right of a panel have smaller effect size, making them more difficult to detect. Each plot point is the average rank across n = 1000 replicate simulations.

