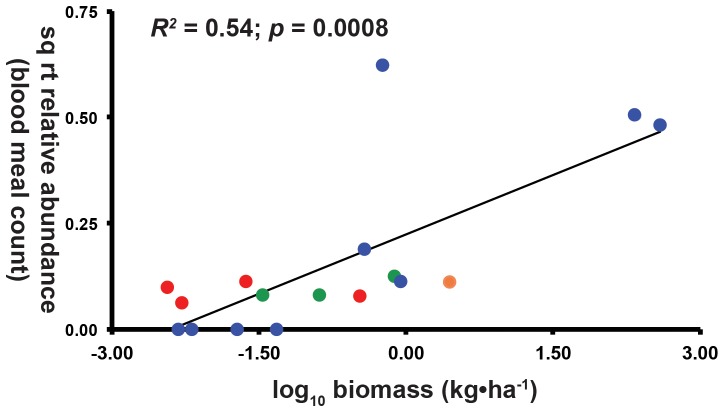
Figure 3. Relative abundance of vertebrate blood meals as a function of estimated host biomass.
Red circles represent wild birds, green circles: wild mammals, orange circle: chickens, blue circles: domestic mammals, humans: black circle. Wild animals have both low biomass and blood meal relative abundance while humans and domestic animals have both high biomass and proportion of the observed blood meals. Estimated host biomass is log-transformed, while blood meal relative abundance is square-root transformed, with data representing biomass for taxa across the matrix of agricultural and forest habitats, see Methods S1 for details on methodology.

