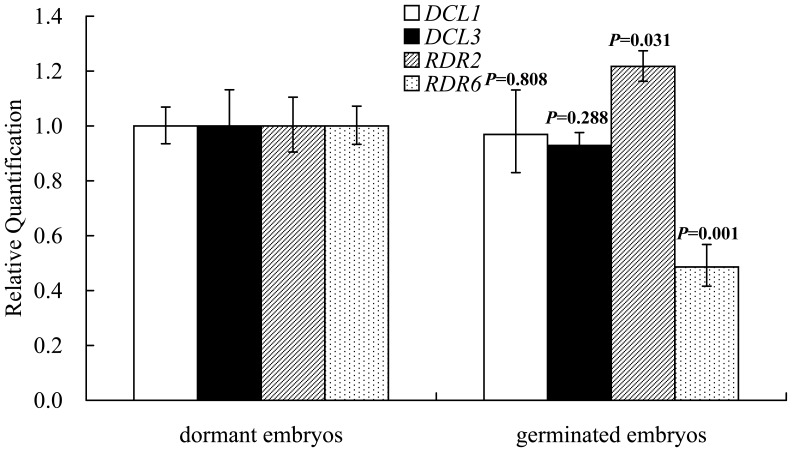
Figure 5. qRT-PCR analysis of the relative expression of DCL1 (white bars), DCL3 (black bars), RDR2 (striped bars), and RDR6 (dotted bars) in dormant embryos and germinated embryos.
All expression levels were normalized to that of EF-1α and then normalized by comparison to the level of dormant embryos, which was set at 1.0. The experiments were repeated three times and error bars represent the SD. The abundance difference of genes between two classes of embryos was evaluated by a t-test using SPSS software (SPSS Inc., Chicago, IL).

