
Figure 2. Protein expression and thermal characterization.
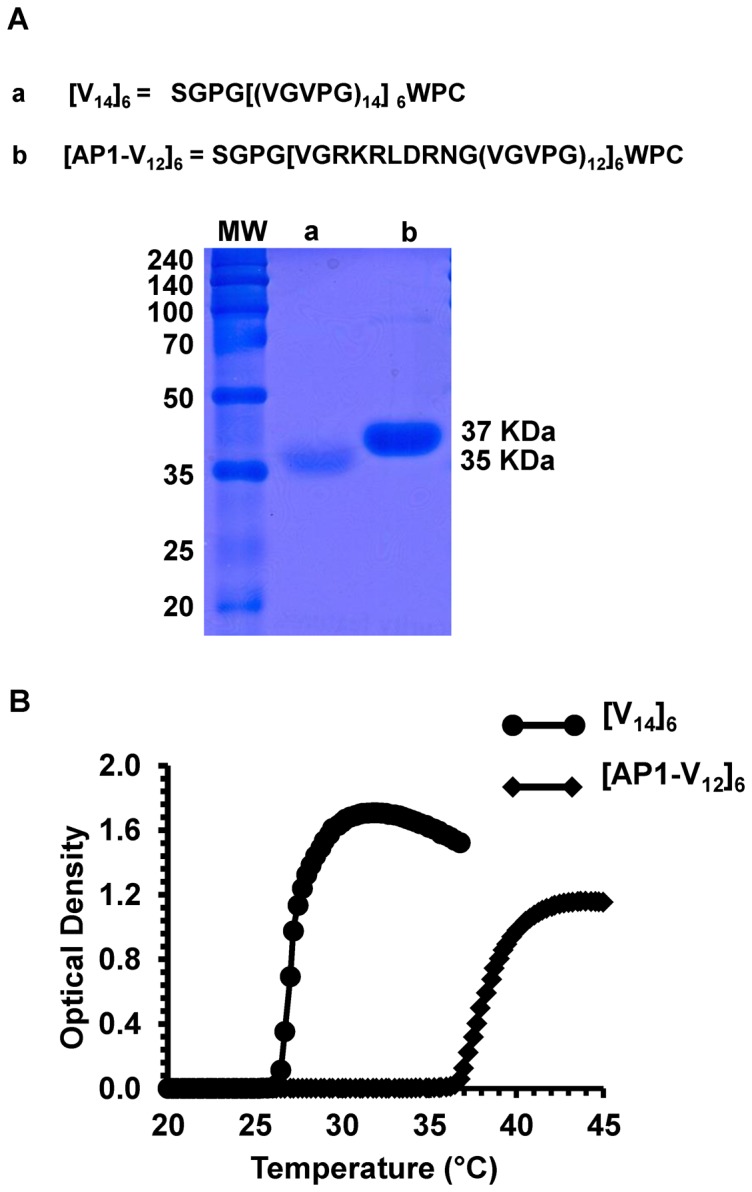
(A) Polypeptide sequences of (a) [V14]6 and (b) [AP1-V12]6, expressed proteins were visualized by Coomassie Blue staining after SDS-PAGE analysis. Left lane: protein molecular weight marker (in kDa). Expected sizes of [V14]6 (∼35 kDa) and [AP1-V12]6 (∼37 kDa) are indicated on the right. (B) The turbidity profiles of [V14]6 and [AP1-V12]6 protein verses OD350 as a function of temperature (increased at a rate of 1°C min−1) were obtained.