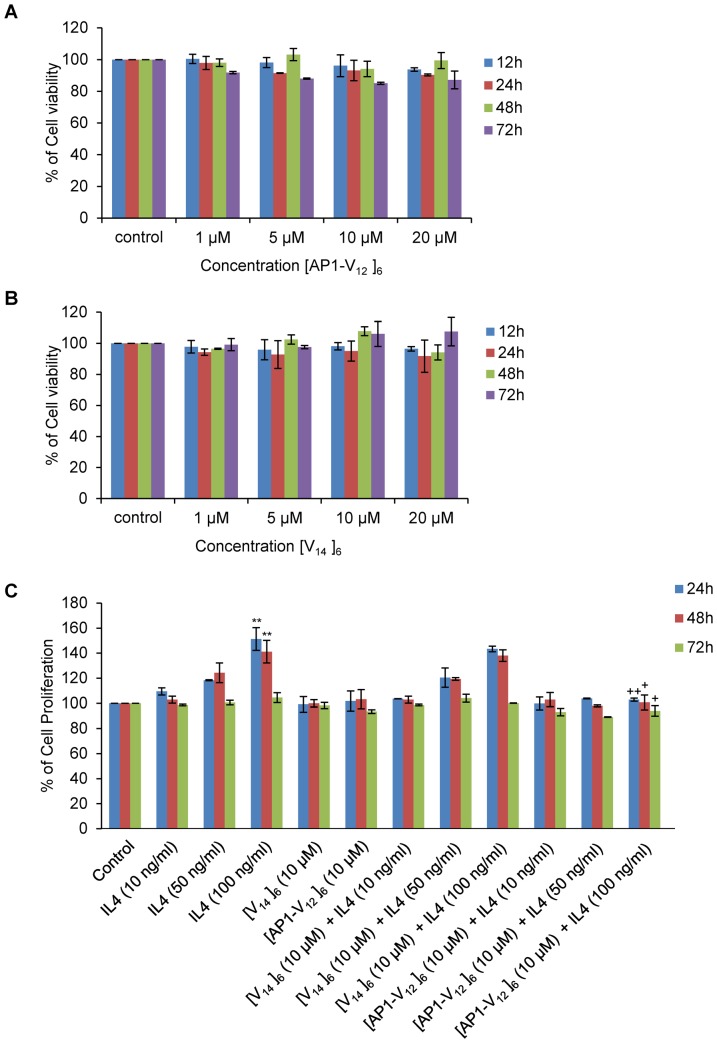
Figure 5. In vitro cell viability and proliferation assay.
(A, B) MDA-MB-231 cells were plated in 96 well plates in serum (10% FBS) containing media and further treated with different concentration of [AP1-V12]6 and [V14]6 (1, 5, 10, 20 µM) for various time intervals (12, 24, 48, and 72 h). Cell viability was accessed by measuring WST-8 absorbance at 450 nm (n = 5) samples at different time intervals. The graph represents the percentage of cell viability in treated cells compared to control (untreated) cells. The result shown here is the representative data of 3 independent experiments. (C) For proliferation assay, MDA-MB-231 (2×10³) cells were serum starved (1% FBS) for 16 h with or without different concentrations of IL-4. To check the effect of [AP1-V12]6 and [V14]6 on IL-4 stimulation, the cells were grown in low serum (1% FBS) media containing different concentration of IL-4 (10, 50, 100 ng/ml) and [AP1-V12]6 and [V14]6 (10 µM) for 24, 48, and 72 h. Cell proliferation was analyzed by measuring the WST-8 absorbance at 450 nm (n = 5 samples). The graph represents the percentage of cell viability in treated cells compared to control (untreated) cells. The result shown here is the representative data of 3 independent experiments. A t-test was performed to determine the significance of various groups after IL-4 and polymer treatments. Control versus IL-4 (100 ng/ml), * = P<0.05 and ** = P<0.001, IL-4 (100 ng/ml) versus [AP1-V12]6 + IL-4 (100 ng/ml), + = P<0.05 and ++ = P<0.001.

