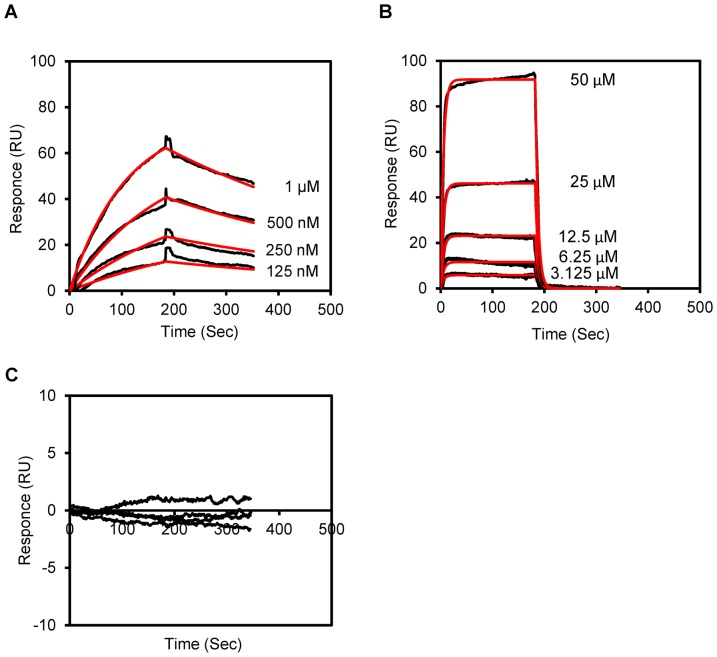
Figure 6. IL-4 R binding affinity of [AP1-V12]6 polymer.
Determination of binding kinetics. Normalized (A) [AP1-V12]6 protein (125 nM - 1 µM), (B) AP1 peptide (3.125 - 50 µM) and (C) [V14]6 (1 µM) binding curves (black line) with fits (red line) obtained using Scrubber 2. Histograms are representative of three independent experiments.

