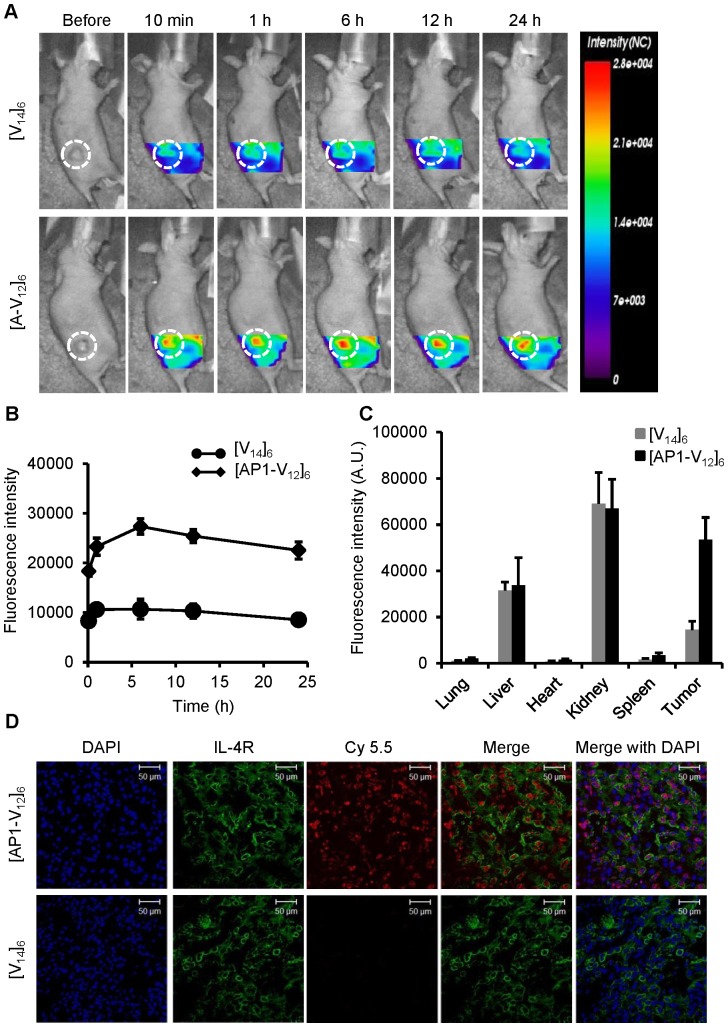
Figure 7. In vivo, ex vivo imaging and biodistribution of [AP1-V12]6 polymers.
(A) Cy5.5-labeled [V14]6 and [AP1-V12]6 (8 mg/kg) were intravenously injected into MDA-MB-231 tumor xenografted nude mice. Biodistribution was determined by collecting in vivo fluorescence images at different time points. Scale bar indicates normalized fluorescence intensity (NC). Representative optical images of three experiments. (B) Quantitation of fluorescence intensities in tumor sites at respective time points (n = 3). (C) Analysis of fluorescence intensities for tumors and organs from ex vivo images (n = 3). (D) Histological analysis of [AP1-V12]6 polymer (red) localization in tumors. Nuclei were stained with DAPI (blue), and IL-4R expression on cells was visualized by anti-IL-4 receptor antibody staining (green). Representative confocal images of three experiments (scale bar 50 µm).

