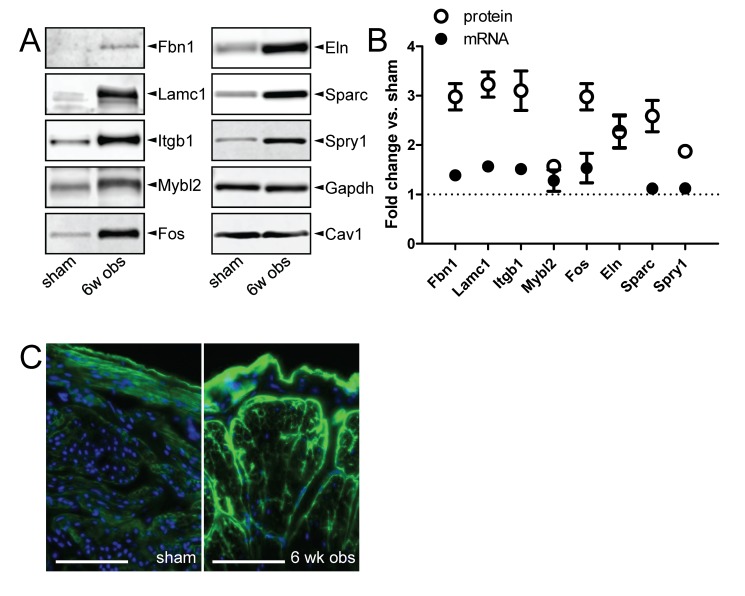
Figure 5. Repression of miR-29 after outlet obstruction is associated with increased levels of miR-29 target proteins.
(A) Western blots for eight miR-29 targets in sham-operated control bladders and at 6 weeks of obstruction. Gapdh and Cav1 were used as loading controls (n=6 throughout). (B) Relative fold change at 6 weeks of obstruction (vs. sham) of miR-29 target messenger RNAs (mRNA; black circles) and proteins (white circles). The fold change of mRNA compared to the fold change of the protein was significantly different throughout, except for Eln and Mybl2. MRNA expression is from the microarrays (n=6−8), and protein expression is from the western blots in A. Protein expression was normalized first to Gapdh and then to the mean for the sham-operated controls. (C) Immunofluorescence staining for collagen IV (col4a1, green) in sham-operated control and 6-wk obstructed detrusor. Scale bars represent 100 µm. The fluorescent pear-shaped profile in the center of the 6 weeks specimen represents the outline of a muscle bundle. Individual cell profiles are visible within the bundles. Nuclei are stained blue and the outer bladder surface is facing upward in both micrographs.

