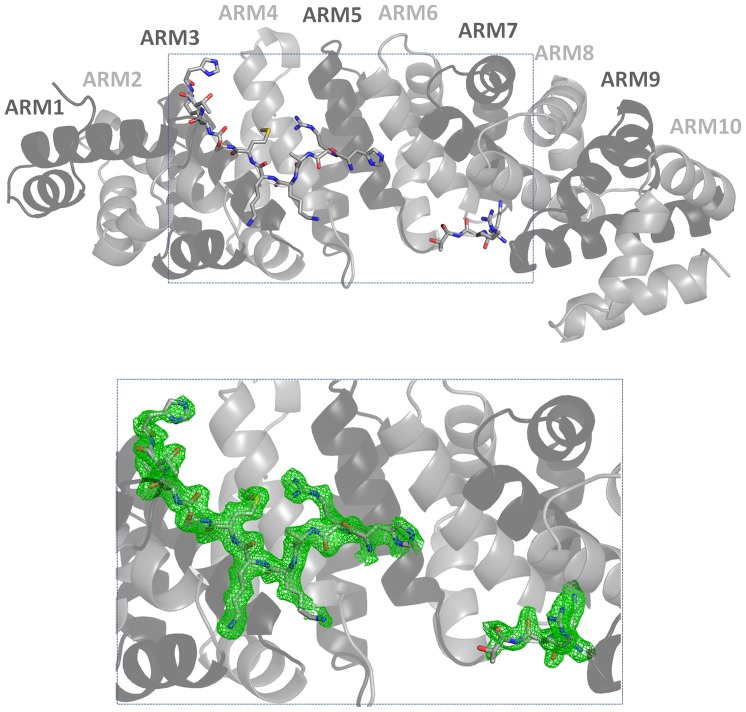
Figure 2. Cartoon overview of the IMPα (in ribbon):Prp20 (stick model) complex structure (top), superimposed on the Fo-Fc annealed omit map (green; calculated using Phenix [30], contoured at 2.0 σ).
Figures were produced using PyMOL (DeLano Scientific LLC).

