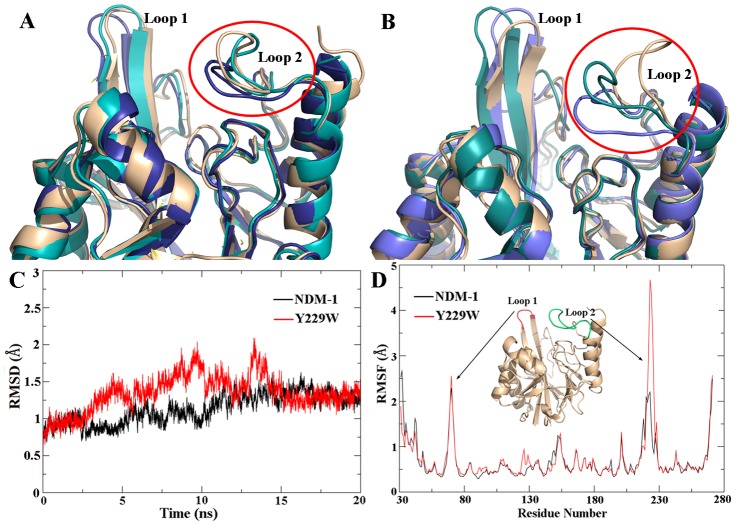
Figure 3. Distinct conformations of Loop 2 obtained by clustering the MD trajectory of the enzymes.
(A) Superimposition of wild-type NDM-1; (B) Superimposition of Y229W mutant. (C) and (D) are the time evolution of the RMSDs and RMSFs of NDM-1 (black curve) and Y229W mutant (red curve) measured against the corresponding starting structures.

