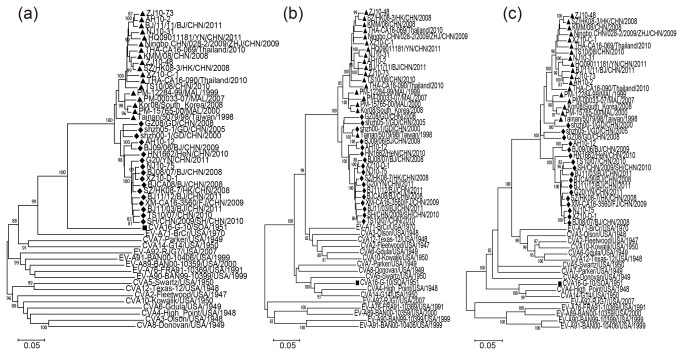
Figure 3. Phylogenetic dendrogram showing the relationships between the cluster B1a, B1b and EV-A prototypes.
These were constructed by the different genomic regions of 35 complete CVA16 genomic sequences and EV-A prototype sequences. The neighbour-joining trees were reconstructed based on the P1 (a), P2 (b), P3 (c) genomic regions and complete genomes (d), respectively. Triangles indicated the subgenotype B1a. Rhombuses indicated the subgenotype B1b. Squares indicated the CVA16 prototype G-10 strain. The percentage of bootstrap (percentage of 1000 pseudoreplicate datasets) supporting the trees are indicated at the nodes; only values over 80% are shown.

