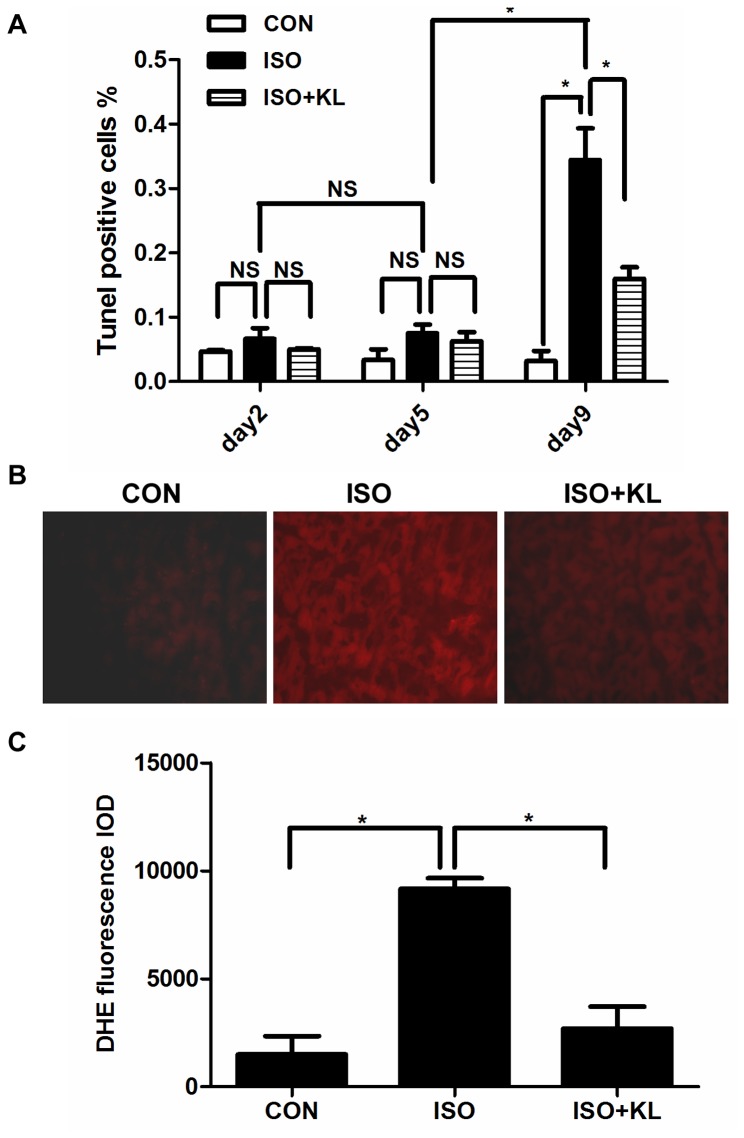
Figure 2. Klotho reduced ISO-induced apoptosis and ROS production.
(A) Quantitative plot of TUNEL positive cells in CON, ISO and ISO+KL groups for 2, 5, 9 days. Apoptosis rate was determined by the ratio of apoptotic nuclei to total nuclei. The average total cells for each section are about 2000. Data are mean±SEM, n=3. * P<0.05 between two compared groups; NS, no significance. (B) Representative images of Dihydroethidium (DHE) staining of LV sections in CON, ISO and ISO+KL groups for 9 days . Red fluorescence represented the ROS production.200×. (C) Quantitative plot of relative DHE fluorescence intensities normalized by CON. Data are mean±SEM, n=3. * P<0.05 between two compared groups.

