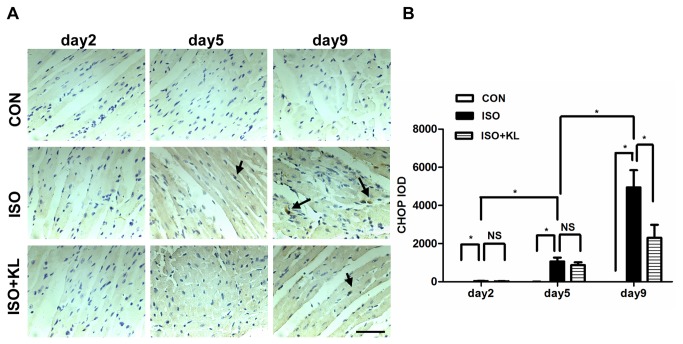
Figure 5. Klotho decreased the expression of CHOP in mouse heart.
(A) Representative images of immunohistochemical staining for CHOP in CON, ISO and ISO+KL groups for 2, 5 and 9 days. Scale bar=50 um, 400×. Black arrows represent the positive staining of CHOP expressed in nuclei. (B) Quantitative plot of average expression of CHOP. The expression level of CHOP in the ISO+KL group was significantly lower than in the ISO group at day 9. Data are mean±SEM, n=5 . * P<0.05 between two compared groups; NS, no significance.

