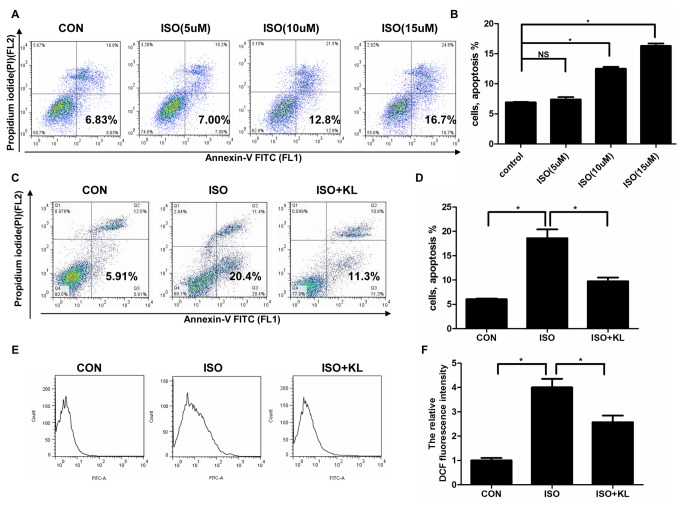
Figure 8. Klotho reduced ISO-induced apoptosis and ROS production in H9c2 cells.
(A) Representative images of apoptosis assay in H9c2 cells treated by different concentrations of ISO. (B) Demonstration of apoptosis rate.(C) Representative images of apoptosis assay in H9c2 cells treated by ISO and/or klotho. (D) Demonstration of apoptosis rate. Data are mean±SEM, n=5. * P<0.05 between two compared groups; NS, no significance. (E) Representative images of DCF fluorescence signal assessed by FCS Express. (F) Demonstration of the relative DCF fluorescence intensity normalized by CON. Data are mean±SEM. n=3 * P<0.05 between two compared groups; NS, no significance.

