
Figure 2. Summary ROC curve plot of diagnosis of perinatal depression based on EPDS ≥9.
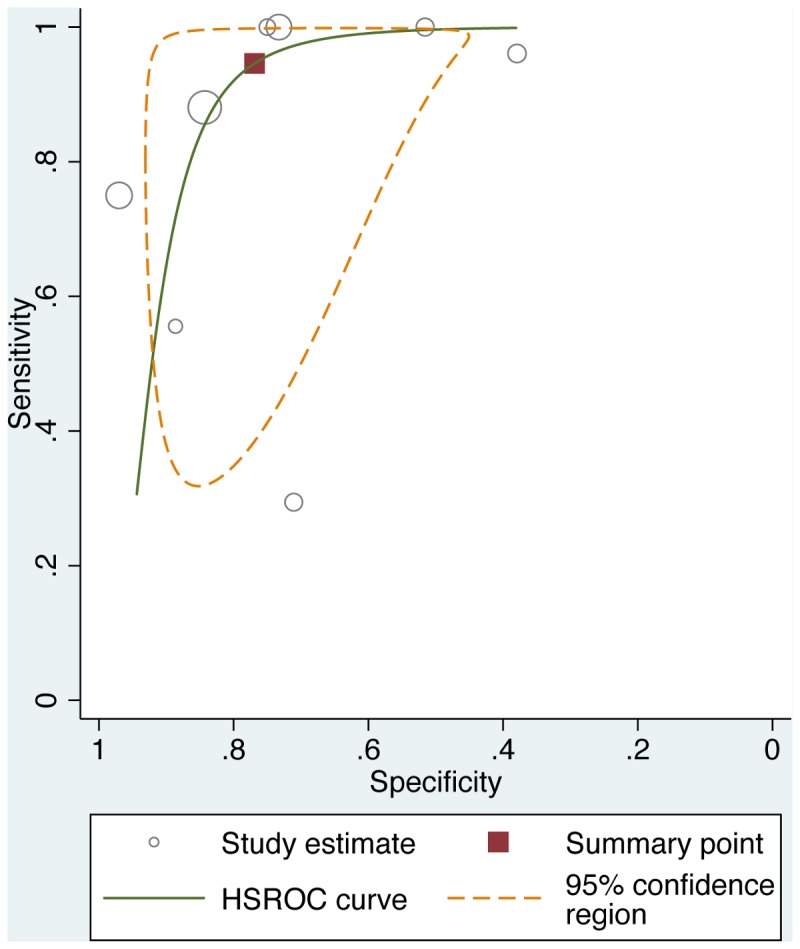
The solid line depicts the summary ROC curve from the bivariate random-effects model. The solid square depicts the summary operating point, i.e., summary values for sensitivity and specificity. The dotted line depicts the 95% confidence region for the summary operating point.