
Fig. 1.
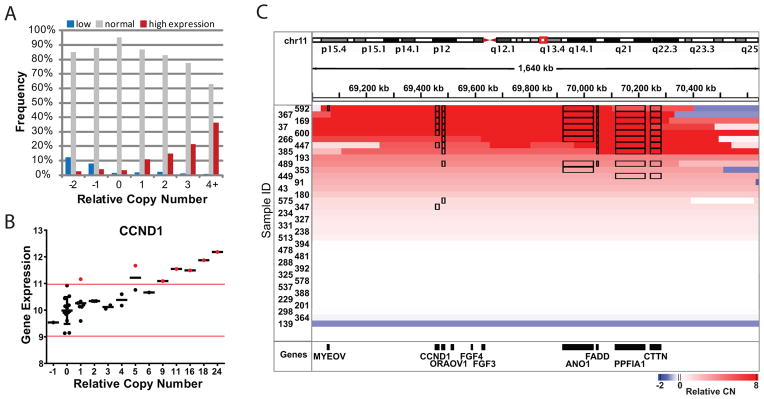
Integrated analysis of gene expression and copy number alterations. A) Copy number and outlier gene expression plot. Frequency indicates how often a gene with the indicated relative CN shows low, normal or high transcript expression. Frequencies were calculated from all genes and all samples with the indicated relative CN. High or low expression identifies samples outside of the 95% confidence interval for expression as described in B below. B) Gene expression vs. copy number for CCND1. Each dot represents one sample. Black horizontal bars designate gene expression mean. Red bars indicate the 95% confidence interval of gene expression for samples with relative CN=0. C) Modified IGV plot for the region around CCND1. Chromosome location is shown at the top. Each row is a sample, and the relative CN is indicated by color. Black boxes around a gene indicate it as an outlier with respect to expression.