Fig. 3.
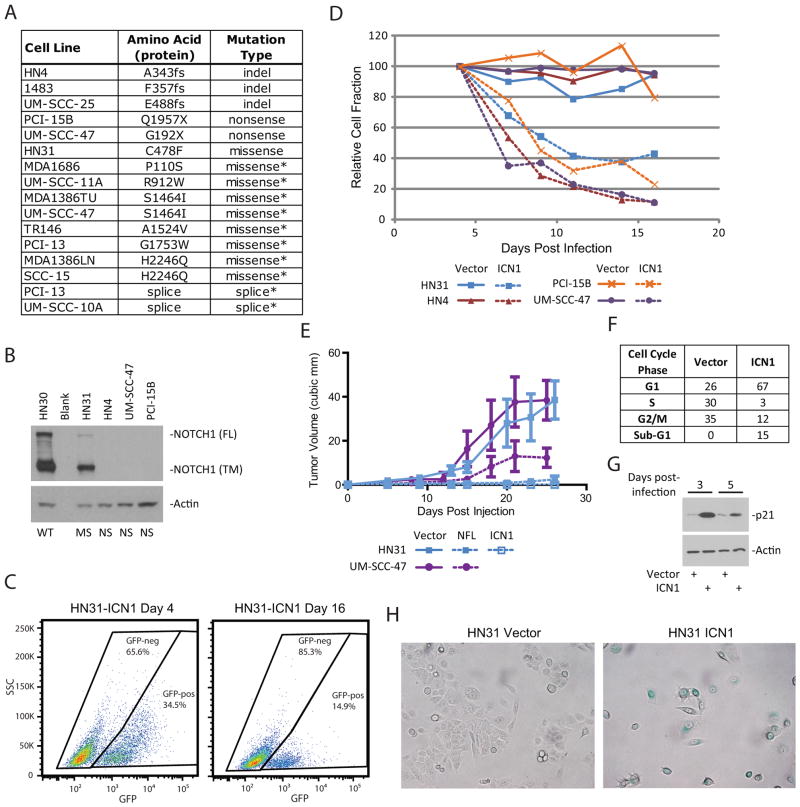
NOTCH1 is detrimental to HNSCC cell lines. A) NOTCH1 genomic alterations identified in HNSCC cell lines. Mutations of unknown significance are indicated with an *. B) Western blot for total NOTCH1 protein. WT=wild-type, MS=missense, NS=non-sense. FL indicates full length NOTCH1, and TM indicates the transmembrane form. Actin is shown as a loading control. C) Flow cytometry for GFP in HN31 cells infected with retrovirus to express activated NOTCH1 (ICN1). The frequency of events is shown inside each gate. D) Relative cell fractions for the “horse-race” experiment. GFP-positive fraction was normalized to the frequency at day 4. Vector controls are shown with solid lines and ICN1-expressing cells are shown with dashed lines. E) Xenograft tumor growth in an orthotopic mouse model of tongue cancer. HN31 or UM-SCC-47 cell lines were infected with virus to express the full-length NOTCH1 (NFL), the activated form of NOTCH1 (ICN1), or the empty vector. F) Cell cycle analysis of HN31 cells expressing ICN1 or empty vector. Samples were analyzed at day 3 post infection. G) Western blot for p21 (CDKN1A) protein in cells expressing ICN1 or vector. Samples were collected that the indicated time post-infection. Actin is shown as a loading control. H) Senescence-associated beta-galactosidase staining in cells expressing ICN1 or vector. Cells with positive staining appear blue.

