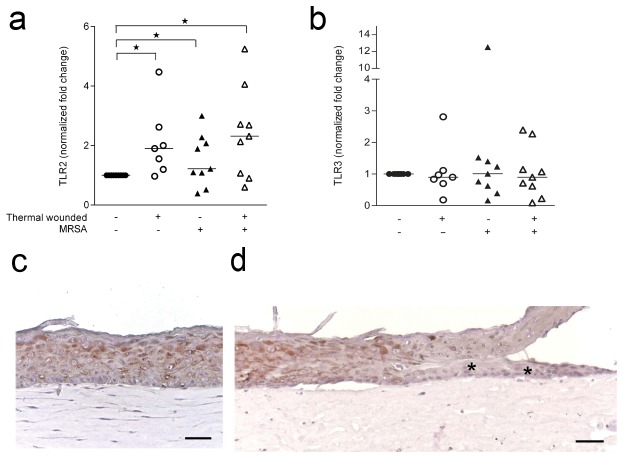
Figure 3. TLR2 and TLR3 expression by thermal wounded and/or MRSA exposed HSEs.
The expression of TLR2 was assessed by quantitative PCR. (a) TLR2 mRNA expression in normalized fold change and (b) TLR3 by thermal wounded and/or MRSA exposed HSEs after 24 hours as compared to control HSEs. Horizontal lines represent the median. *P<0.05, as compared to control HSEs. (c) TLR2 protein expression in cross-sections of control HSEs. (d) Thermal wounded HSEs. N=6-8. * indicates re-epithelialization. Scale bars = 50 μm.

