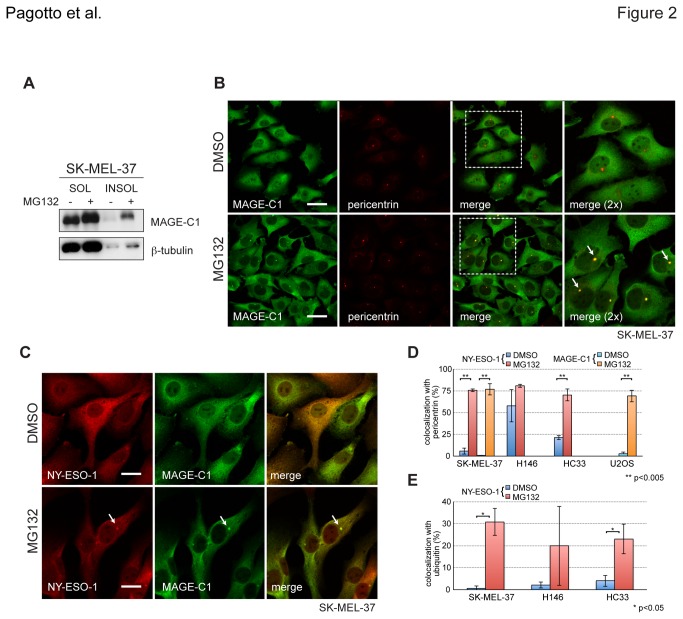
Figure 2. MAGE-C1 enriches at centrosomes with inhibition of proteasome activity.
A) Western blot of MAGE-C1 from lysates of SK-MEL-37 cells treated with DMSO (negative control) and MG132 (40μM, 4hrs). RIPA-soluble (SOL) and –insoluble (INSOL) fractions are shown. B) Immunofluorescence micrographs of endogenous MAGE-C1 (green) and pericentrin (red) in SK-MEL-37 cells. Merged images are also shown. Scale bars = 20μm C) Immunofluorescence micrographs of endogenous MAGE-C1 (green) and NY-ESO-1 (red) in SK-MEL-37 cells. Scale bars = 10μm. In all images, white arrows indicate centrosomes. D) Bar graphs presenting the percentage of NY-ESO-1 and MAGE-C1 puncta colocalised with pericentrin for SK-MEL-37 (MAGE-C1/pericentrin - DMSO: 0.42±0.72 and MG132: 76.94±6.61, p=0.00222; NY-ESO-1/pericentrin – DMSO: 5.77±3.74 and MG132: 75.77±1.73, p=0.00013), U2OS (MAGE-C1/pericentrin - DMSO: 2.75±1.74 and MG132: 69.28±6.79, p=0.00212), HC33 (NY-ESO-1/pericentrin - DMSO: 21.32±2.39 and MG132: 70.23±6.86, p=0.00312) and H146 (NY-ESO-1/pericentrin - DMSO: 57.86±18.53 and MG132: 80.95±1.80, p=0.16289) cells. Although H146 cells express MAGE-C1, it was not included in this analysis. E) Bar graphs presenting the percentage of colocalised NY-ESO-1 and ubiquitin puncta for SK-MEL-37 (DMSO: 0.65±1.12 and MG132: 30.81±6.09, p=0.01139), HC33 (DMSO: 4.09±2.52 and MG132: 23.06±6.70, p=0.02739), and H146 (DMSO: 2.14±1.43 and MG132: 20.00±18.03, p=0.22733) cells. Mean, standard deviation and significance are shown.

