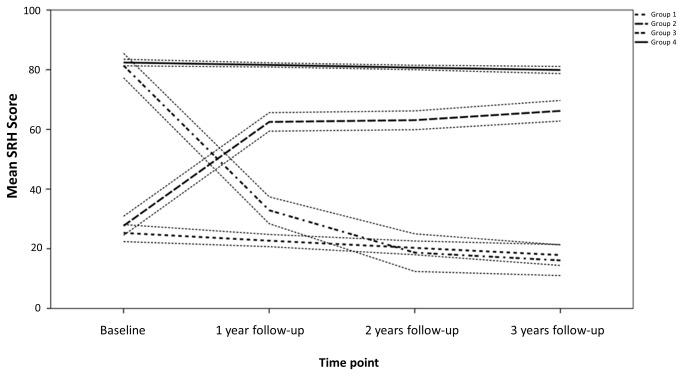
Figure 1. Self Rated Health (SRH) Trajectories, with 95% Confidence Intervals, for the Four Group Model (with Age, Sex and Education as Covariates), in the Montreal Diabetes Health and Well Being Study, 2008-2011.
Note. Group 1: persistently poor SRH; Group 2: progressively increased SRH; Group 3: progressively decreased SRH; Group 4 persistently good SRH.

