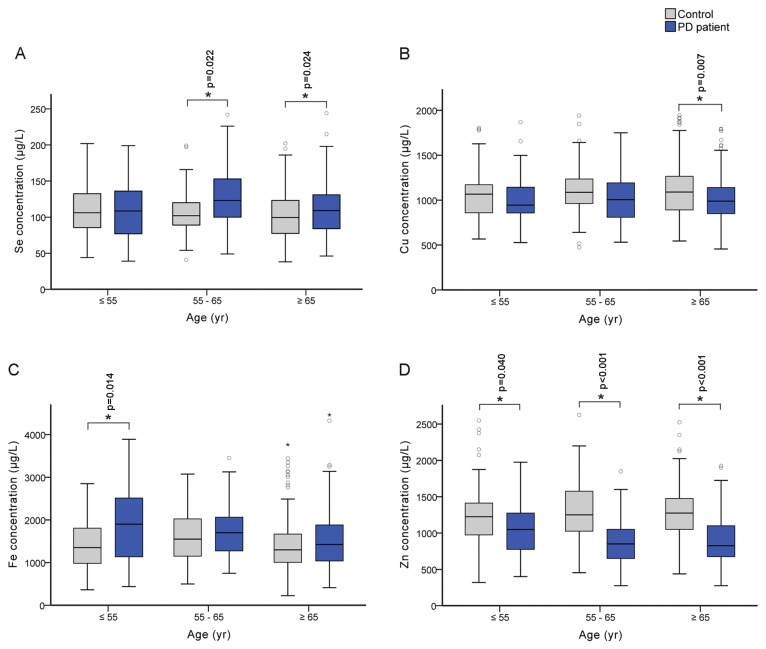
Figure 1. Plasma trace element concentrations in three age groups of PD patients and controls.
The number of subjects with age ≥55, 55~65, ≤65 were 38, 53, 147 respectively for PD patients, and 71, 59, 172 respectively for controls. Box charts represent the distribution of plasma Se (A), Cu (B), Fe (C) and Zn (D) concentrations. Data were analyzed with Mann-Whitney U-test and significant difference was marked with * for p <0.05.

