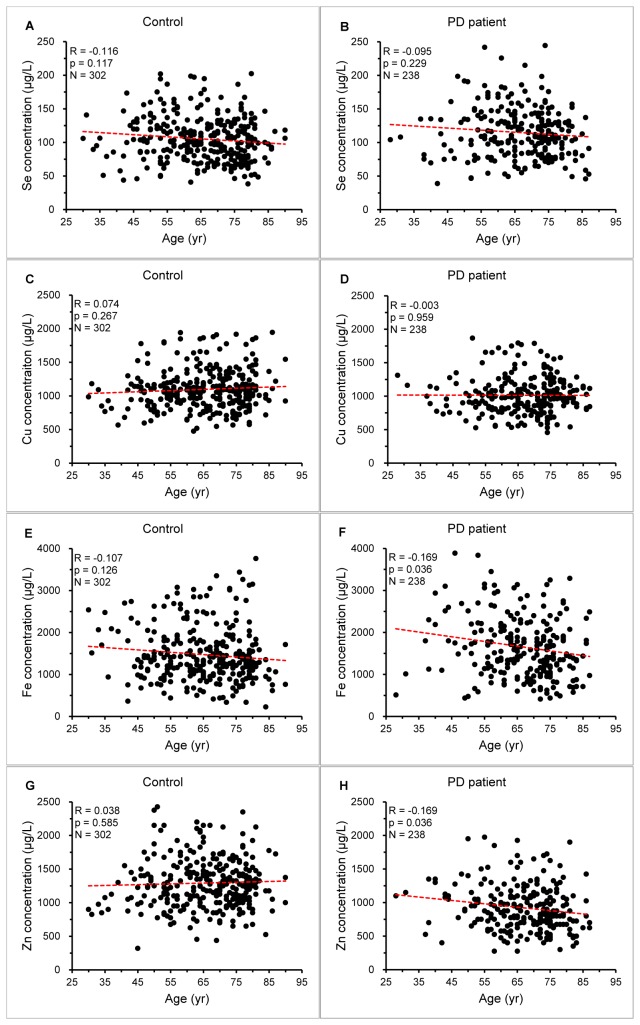
Figure 2. Relationship between plasma trace element levels and age.
The scatters represent the correlation of plasma Se (A and B), Cu (C and D), Fe (E and F) and Zn (G and H) levels with age in PD patients and controls. The parameters showed in the figure represent the performance of the linear regression (red dash line).

