
Figure 4. Positioning ERK, PI3K, p38MAPK, and PKC, with respect to each other.
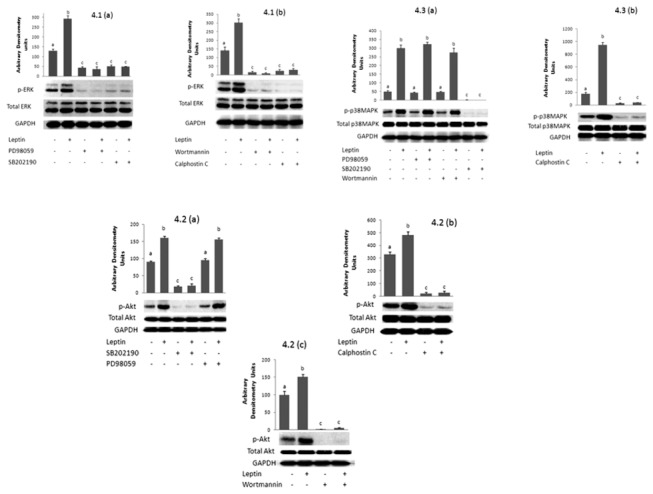
Effect of leptin (10 nM, 50 min) on
4.1 phosphorylated ERK when
(a) ERK and p38MAPK are inhibited with PD98059 and SB202190 respectively, (b) PI3K and PKC are inhibited respectively with Wortmannin and Calphostin C.
4.2 phosphorylated Akt when
(a) ERK and p38MAPK are inhibited with PD98059 and SB202190 respectively, (b) PKC is inhibited with Calphostin C
(c) PI3K is inhibited with Wortmannin,
4.3 phosphorylated p38MAPK when
(a) ERK, p38MAPK and PI3K are inhibited respectively with PD98059, SB202190 and Wortmannin,
(b) PKC is inhibited with Calphostin C.
All the results are representative of an experiment repeated 3 times. Bands were quantified using the gel- Pro Analyzer 3.0 software and are accompanied by their densitometric analysis. The intensity of the bands is reported as “arbitrary densitometry units”. Letters on top of the bars indicate significant difference. Bars having different letters are significantly different from each other (P<0.01).