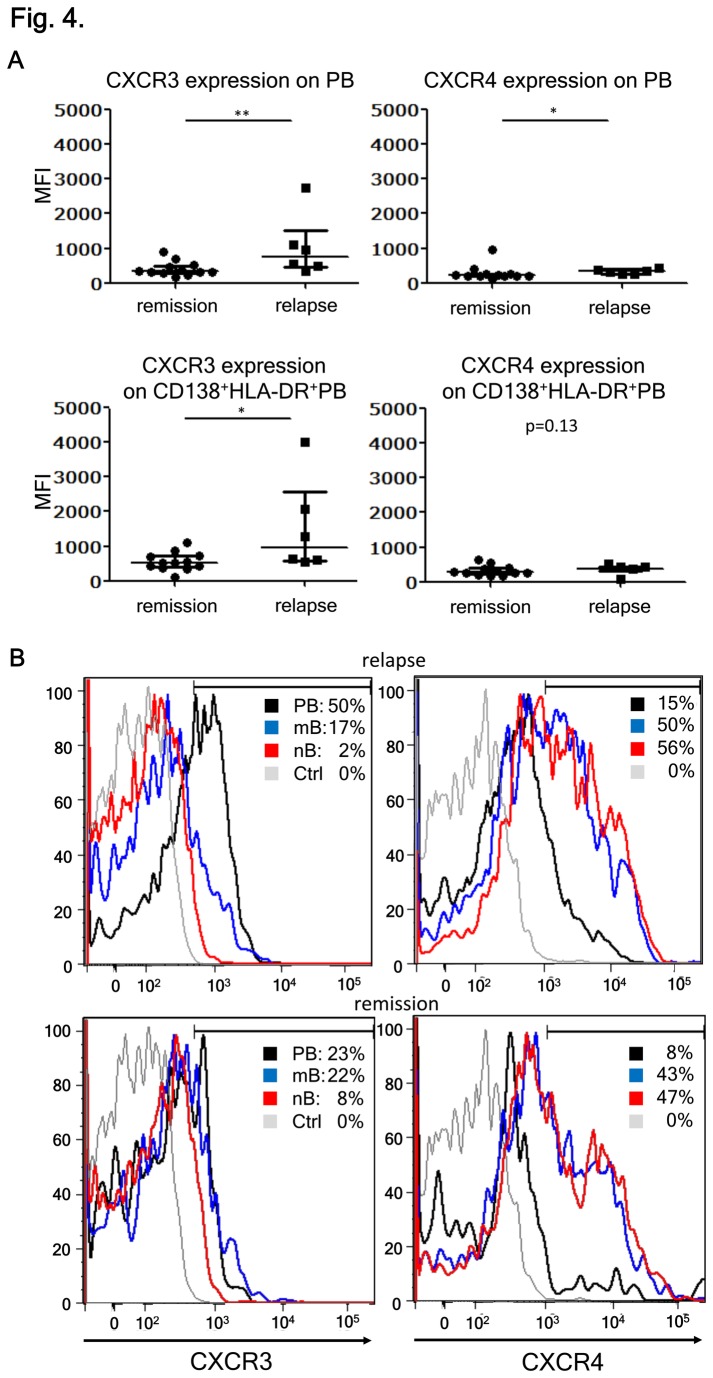
Figure 4. CXCR3 expression on plasmablasts (PBs) correlates with the disease state.
(A) CXCR3 and CXCR4 on PB in neuromyelitis optica (NMO) relapse and remission. Here, we compared the mean fluorescence intensity (MFI) of CXCR3 and CXCR4 expression in the peripheral blood PBs during remission and relapse of NMO. MFI of CXCR3 and CXCR4 expressions on CD138+HLA-DR+ PBs were also analyzed [**p < 0.01 and *p < 0.05 by Mann–Whitney test; each error bar represents the median ± interquartile range (IQR]].
(B) B-cell subpopulations derived from peripheral blood mononuclear cells (PBMC) during disease relapse and remission were analyzed by flow cytometry to investigate the expression of CXCR3 and CXCR4. The values represent the percentages of CXCR3+ or CXCR4+ cells within each B-cell subpopulation. Unstained control of PBMC is indicated by Ctrl. Representative data of at least five patients in each disease state are shown.

