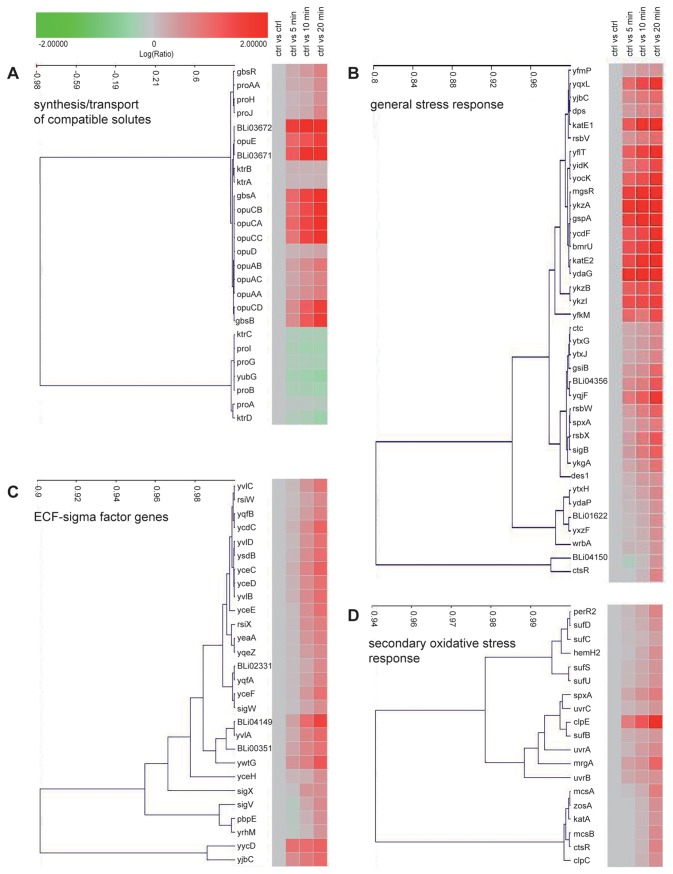
Figure 2. Cluster analysis of transcriptional changes in response to a sudden salt challenge.
Cells of B. licheniformis DSM 13T were cultivated in BMM with glucose as the carbon source until they reached early exponential growth phase (OD500nm of about 0.4) when they were exposed to a sudden salt shock (the final NaCl concentration in the growth medium was 1.0 M). Immediately before and at the indicated time intervals subsequent to the imposed increase in the external salinity, cells were withdrawn and used for the isolation of total RNA for a genome-wide transcriptional analysis. The derived data were then subjected to a cluster analysis and grouped according to known salt stress response clusters from B. subtilis [39,65]: (A) Synthesis and transport of compatible solutes, (B) general stress responses, (C) ECF-sigma factor genes, and (D) secondary oxidative stress response. The correlation of the transcription patterns of the different clustered genes is represented on the X-axis (cosine correlation). Detailed values for the transcriptional profile of individual genes are given in Table S1. Genes marked in red represents those whose transcription is up-regulated in response to osmotic stress.

