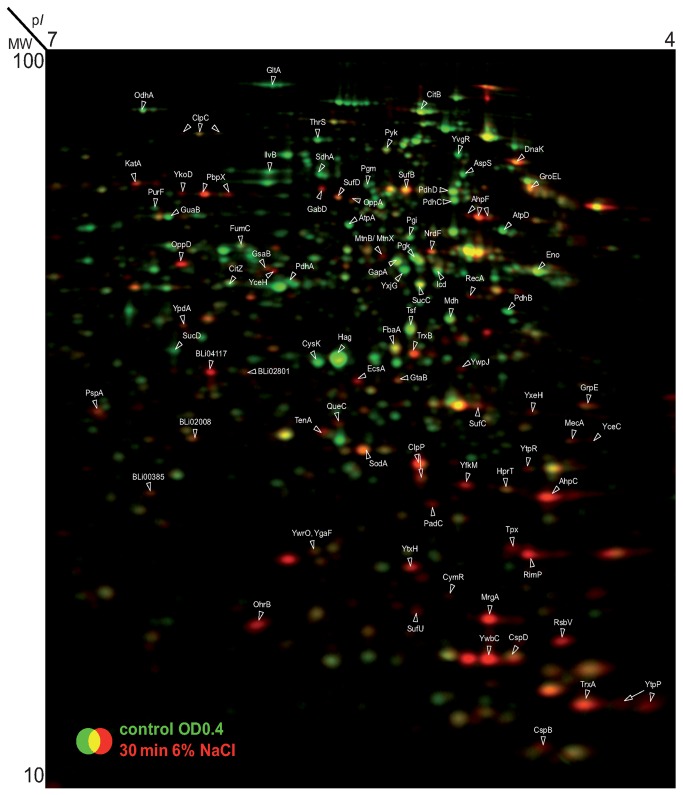
Figure 3. The cytosolic proteome of salt-stressed B. licheniformis DSM 13T cells 30 min after the imposition of a NaCl shock.
Cells of B. licheniformis DSM 13T were cultivated in BMM with glucose as the carbon source until they reached early exponential growth phase (OD500nm of about 0.4) when they were exposed to a sudden salt shock (the final NaCl concentration in the growth medium was 1.0 M). 30 min after the exposure to the salt stress, samples of cells were harvested and processed for 2D-PAGE analysis; proteins were separated in a pH gradient 4‑7. The control sample of the cells was harvested just prior to the imposed salt shock. Cell samples were labeled with L-[35S]-methionine during the exponential growth phase (control, OD500nm 0.4) and 30 min after the addition of NaCl. Dual channel images were created from the 2D-gels with the Delta 2D software (Decodon GmbH, Greifswald, Germany).

