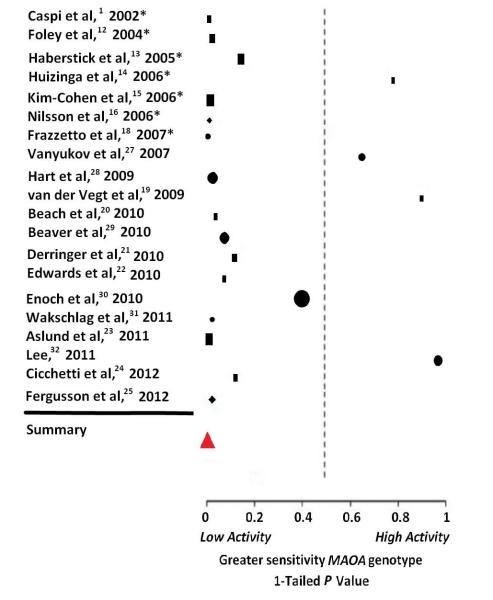
Figure 1.
Forest plot of 20 male samples for the interaction of MAOA genotype and early life adversities on aggressive and antisocial behavior. Icons indicate the 1-tailed P value for each sample, where lower values denote a greater sensitivity to adversity with low-activity MAOA genotype and high values denote a greater sensitivity with high-activity MAOA genotype. The size of the icon reflects relative sample size. Squares mark studies that indexed adversity specifically to childhood maltreatment; circles indicate studies of other childhood adversities; and diamonds indicate studies that included both maltreatment and other childhood adversities. The red triangle depicts the overall result of the meta-analysis for all-male samples (2-tailed). Studies marked with an asterisk were included in the prior meta-analysis by Taylor and Kim-Cohen11.

