
Figure 4.
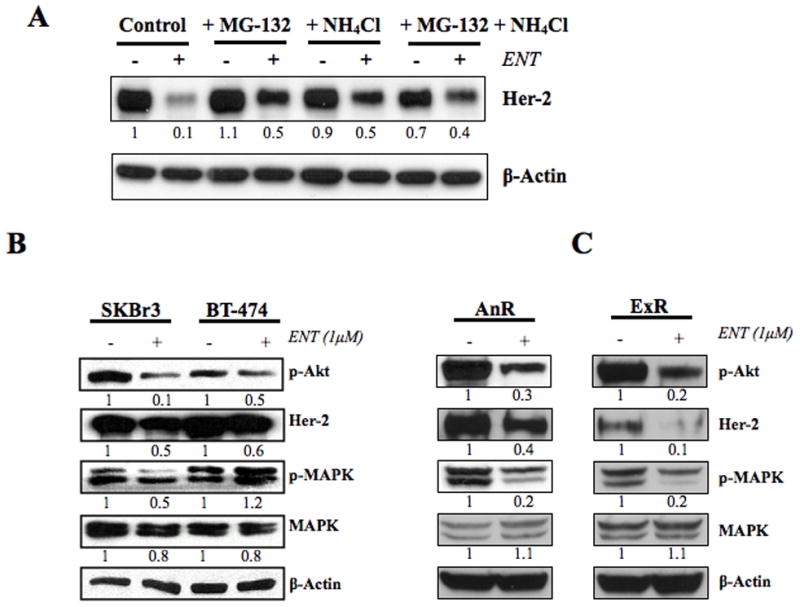
Figure 4A: Western blotting analysis of LTLT-Ca cells treated with entinostat alone or in presence of MG-132 (proteosomal inhibitor) or NH4Cl (lysosomal inhibitor): LTLT-Ca cells were treated with ENT (1μM) alone or in presence of MG-132 (5μM) or NH4Cl (100μM) or both. Protein expression in the cells was examined by western immunoblotting as described in “materials and methods”. Blots were probed for β-actin to verify equal loading. The numbers below the blots show densitometric values that are corrected for loading.
Figure 4B: Western blotting analysis of SKBr3 and BT-474 cells treated with entinostat: Her-2 positive SKBr3 and BT-474 cells were treated with ENT (1μM). Protein expression in the cells was examined by western immunoblotting as described in “materials and methods”. Blots were probed for β-actin to verify equal loading. The numbers below the blots show densitometric values that are corrected for loading.
Figure 4C: Western blotting analysis of AnR and ExR cells treated with entinostat: Her-2 positive anastrozole resistant (AnR) and exemestane resistant (ExR) cells were treated with ENT (1μM). Protein expression in the cells was examined by western immunoblotting as described in “materials and methods”. Blots were probed for β-actin to verify equal loading. The numbers below the blots show densitometric values that are corrected for loading.