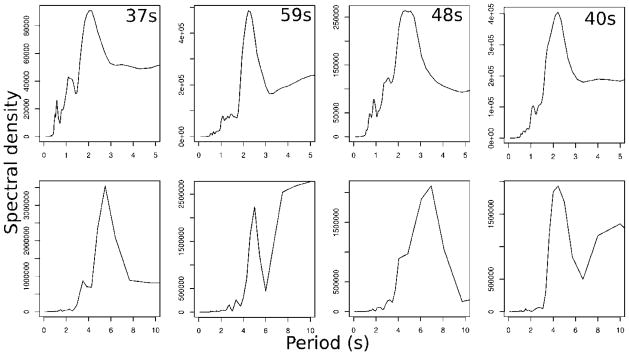
Figure 3.

Sample spectral density plots for four individual males from the 21 August 2010 swarm. The top row of plots shows period against spectral density for the first principal component of the horizontal movement; the bottom row shows the vertical. Track lengths for each individual are given in the top row.
