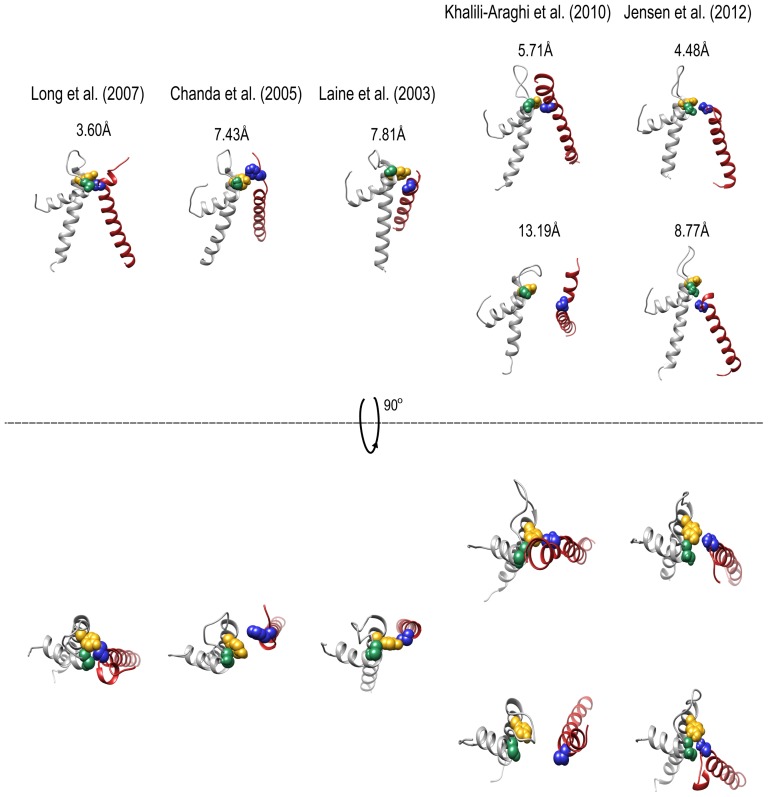
Figure 8. The intimate upper interface residue network loosens upon Kv channel closure.
Side and top view comparisons of the upper interface residue network between the open Kv channel structure (left) and the different models of the closed channel state (indicated by the reference notation above each rectangle). Structures were first aligned using the sPDB viewer to allow a common coordinate system. Panel figures were prepared using the Molecular graphics UCSF Chimera package [34]. The number in each panel represents the shortest atom distance (in Å) between the T248 and Y415 residue pair. Note that in two closed state models ([29], [33]), apparent asymmetry is observed along the upper domain interface. Space-filling representations of the Kv S1 T248, S5 Y415 and P S428 residues are highlighted in blue, gold and green, respectively, as in Fig 1C .

