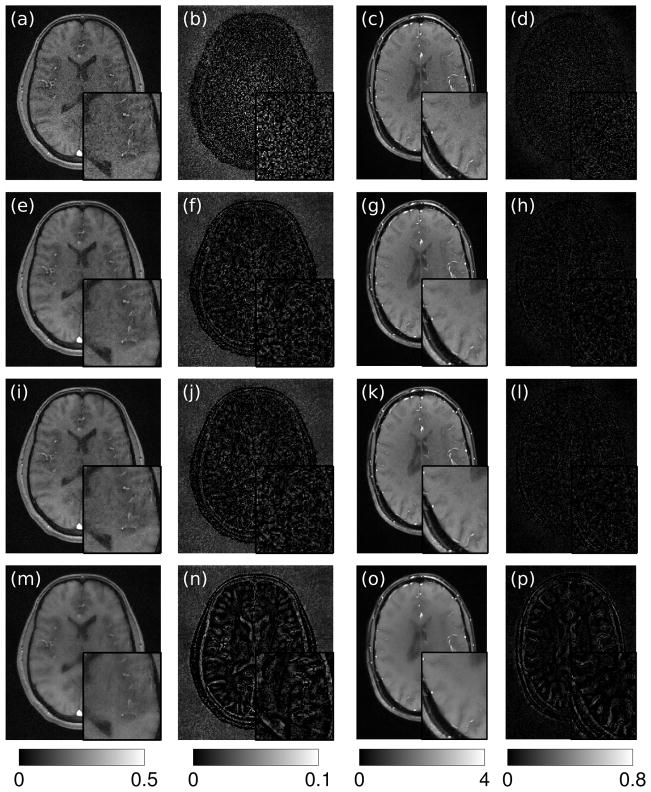
Figure 5.
The GRAPPA-reconstructed image (a) and difference image (b) for data set #1 with 10.3 dB input SNR display significant noise, while DESIGN with both WMSE-optimal (e,f) and WSURE-optimized (i,j) choices of γ effectively denoise the image while losing only a small amount of detail. The L-curve-based method (m,n) oversmooths the image, resulting in significant blurring artifacts. Similar results are observed for the second data set with 16.7 dB input SNR, where remaining noise in the GRAPPA reconstruction (c,d) is mitigated by DESIGN using the WMSE-optimal (g,h), WSURE-optimized (k,l), and L-curve-selected (o,p) choices of γ. Again, oversmoothing in the L-curve-based reconstruction is visible in the second data set. The difference images are displayed at 5× scale.

