Figure 2.
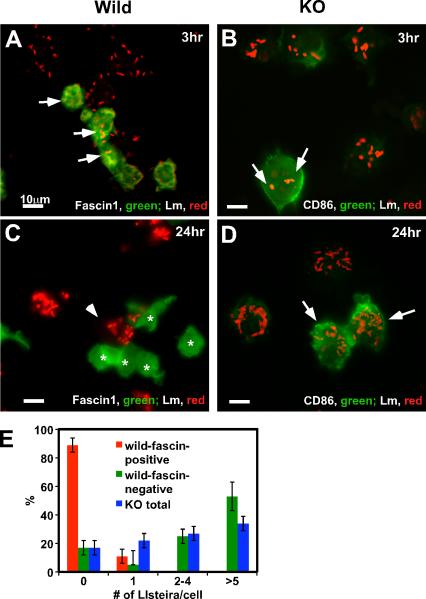
Fascin1-expressing DCs are resistant to Lm infection. A-D, Immunofluorescence images of wild type (A & C) and fascin1 KO (B & D) DCs infected with Lm for 3hr (A & B) and 24hr (C & D). DCs were infected with Lm at a moi of 3.0. At indicated time, wild type DCs were stained with anti-Lm (red) and anti-fascin1 (green) antibodies and fascin1 KO DCs were stained with anti-Lm (red) and anti-CD86 (green) antibodies. Bar, 10μm. E, Quantitative analyses of Lm infection in fascin1-positive, wild type DC (red bars), fascin1-negative, wild type DCs (green), and fascin1 KO DCs (blue). Twenty four hours after infection, wild type, fascin1-positive DCs (n=49), as well as wild type, fascin1-negative DCs (n=94), and fascin1 KO (n=100) DCs, were analyzed by immunofluorescence, and the number of intracellular Lm per DC was counted. For each type of DC, non-infected cells and cells infected with one, two to four, or more than 5 Lm were expressed as percentages of total cells. P values of Lm infection between fascin1-positive, wild type DCs and fascin1-negative wild type DCs and between fascin1-positive, wild type DCs and KO DCs are less than 0.0001. On the other hand, the difference between fascin1-negative, wild type DCs and fascin1 KO DCs is statistically insignificant. Error bars, standard deviation. Representative results from three independent experiments.

