Figure 4.
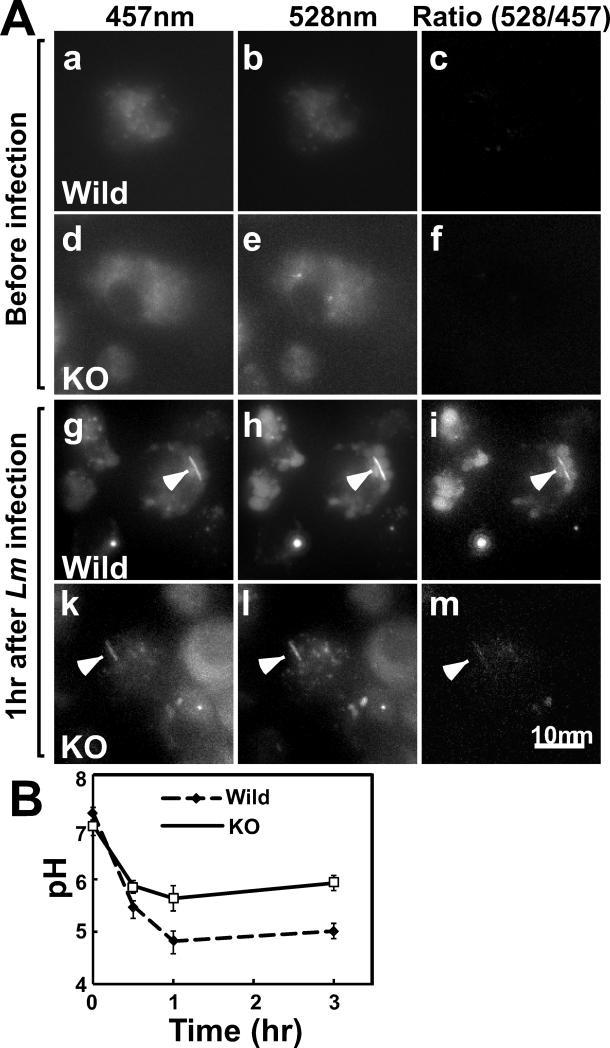
Vacuolar pH is lower in wild type DCs than in fascin1 KO DCs. A, Ratiometric images of wild type (a-c, g-i) and fascin1 KO (d-f, k-m) DCs. Representative images at 457nm and 528nm emission, as well as corresponding ratio images before (a-f) and after (g-m) infection are shown. Arrowheads indicate Lm. B, Time course of vacuolar pH changes of wild type and fascin1 KO DCs. Error bars, standard deviation. Representative results from three independent experiments.

