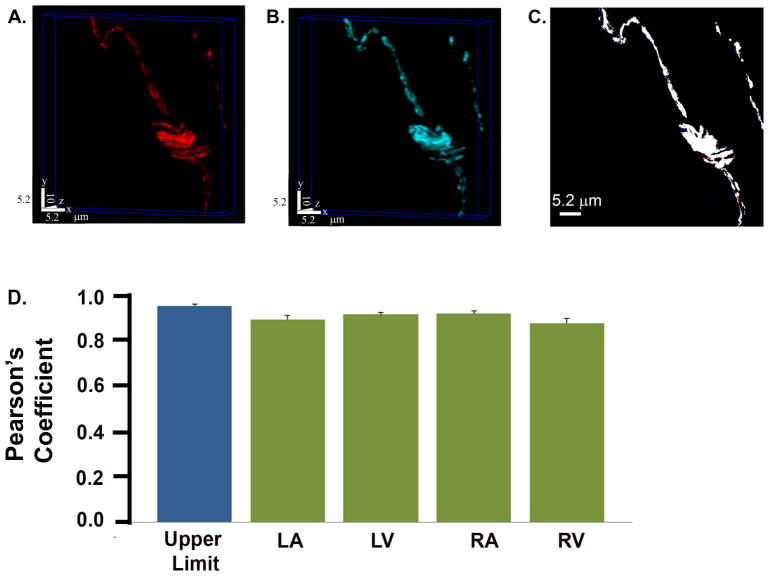
Figure 2.
Intracardiac distribution of EGFP tracks sympathetic axons. A and B, Pair of volume-rendered confocal z-stacks obained from a cardiac section (52.7 × 52.7 × 10.0 μm3) co-stained with tyrosine hydroxylase (A; Alexa546 label) and EGFP (B; Alexa633 label) antibodies. C, Co-localization map of the maximum intensity xy projection of the merged stack. If the pixel is white, both proteins occupy that pixel. D, Bar graphs of mean ± SEM Pearson’s co-localization coefficients for the right ventricle (RV), right atrium (RA), left atrium (LA), and left ventricle (LV). Values are from 15 image stacks each per region equally distributed among 3 hearts. There was no significant difference between each region and the empirical limit of co-localization (P > 0.05 by ANOVA).

