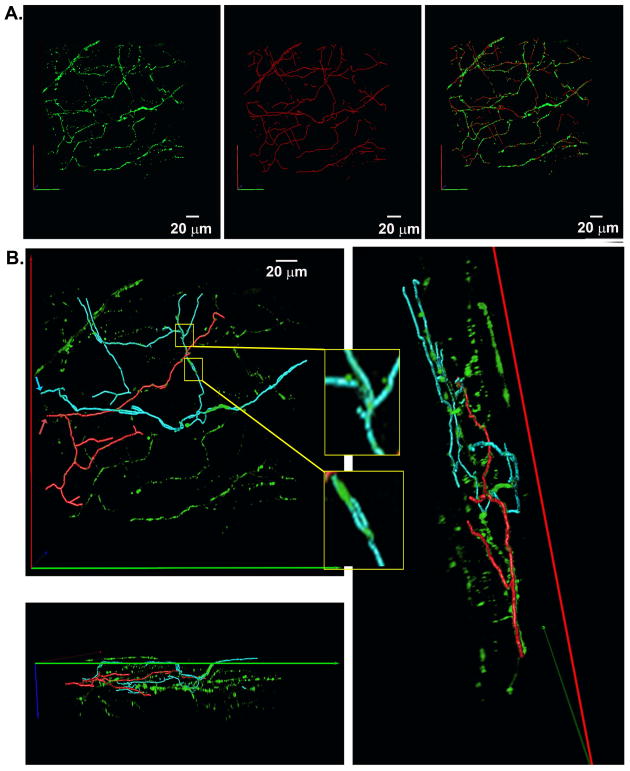
Figure 5.
3-D topological skeleton of the sympathetic arbor within a finite volume of the left ventricular subepicardium. A, A complete 3-D skeleton of all green fluorescent axons was generated using the semi-automated tracing algorithm and rendered in 3-D. The left, middle and right panel show the 3-D original imaging data, the 3-D skeleton, and the overlay of the 3-D original data and the 3-D skeleton, respectively. B, Two examples of sympathetic subtree trajectories. The subtrees’ trajectories (cyan and red traces) were obtained by highlighting all axonal segments that were physically linked to their respective upstream reference points. The two reference points were chosen to be the entry points of the subtrees’ initial segments into the imaged volume (red and cyan arrows). Panels show the overlay of the two colored subtree skeletons and the 3-D EGFP data set at three different view angles. Inserts display small-diameter loops denoted by the yellow boxes.

