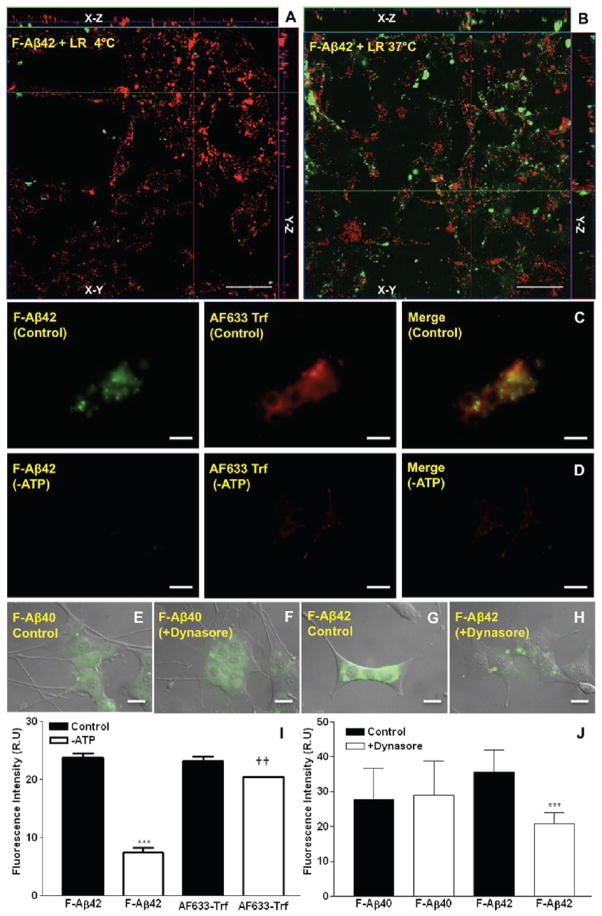
Figure 1.
A, B: Effect of temperature on the uptake of F-Aβ42 by PC12 cells. (A) Z-Stack images of differentiated PC12 cells incubated with 3.5 μM F-Aβ42 and 75 nM Lysotracker Red (LR) for 30 min at 4 °C. (B) Z-Stack images of differentiated PC12 cells incubated with 3.5 μM F-Aβ42 and 75 nM Lysotracker Red (LR) for 30 min at 37 °C. C, D, J: Effect of ATP depletion on the uptake of F-Aβ42 by PC12 cells. Differentiated PC12 cells were incubated with 3.5 μM of F-Aβ42 and 15 μg/mL of Alexa Fluor labeled transferrin (AF633-Trf) for 60 min. (C) Intracellular accumulation of F-Aβ42; and intracellular AF633-Trf, overlay of images F-Aβ42 and AF633-Trf. (D) Uptake of F-Aβ42 and AF633-Trf in differentiated PC12 cells depleted of cellular ATP, overlay of F-Aβ42 and AF633-Trf images. (I) Quantification of intracellular fluorescence intensities using Image J software. Data obtained from 25 to 30 cells was presented as mean ± SEM. One-way ANOVA followed by Tukey post-test showed the following: ***p < 0.001, F-Aβ42 uptake in normal versus ATP depleted cells; ††p < 0.01, AF633 Trf uptake in normal versus ATP depleted cells. E–H, J: Inhibition of F-Aβ40 uptake by Dynasore. (E, F) Differentiated PC12 cells were treated with 3.5 μM F-Aβ40 for 60 min. (E) Intracellular F-Aβ40 fluorescence and overlay on differential interference contrast image (DIC). (F) Uptake of F-Aβ40 by differentiated PC12 cells following pretreatment with 80 μM Dynasore, a dynamin inhibitor and image G overlaid on the DIC image. Inhibition of F-Aβ42 uptake by Dynasore (G, H): intracellular F-Aβ42 fluorescence in differentiated PC12 cells. (G) Intracellular F-Aβ42 fluorescence and overlay on DIC image. (H) F-Aβ42 uptake following a 60 min pretreatment with 80 μM Dynasore overlay on DIC image. (J) Intracellular fluorescence intensities were quantified using Image J software. Data obtained from 30 to 40 cells was presented as mean ± SEM. One-way ANOVA followed by Tukey post-test showed the following: ***p < 0.01, FAβ42 uptake in control PC12 cells versus F-Aβ42 uptake in PC12 cells treated with Dynasore. Scale bars = 25 μm.

